This page lists examples of network visualizations created with NetPanorama, each of which demonstrates a specific feature.
Click an image to see the corresponding code in either a tutorial page or the interactive editor.
You can find the same examples list within the editor.
Visualization Design: node-link, arc-diagram, matrix, jigsaw, hybrid, scatterplot, hiveplot, map, small-multiples, timeline, adjacency-list, parallel-edges, link-wave Data Import: json, csv, pajek, inline, multiple-tables Network: yieldNodes, yieldLinks Transformations: filterNodes, filterEdges, aggregateNodes, aggregateEdges, removeIsolated, connect, reverseEdges, setDirectness, swapNodesAndEdges, promote, calculate, connectivityBasedAttribute, clustering, project Layout: procedural, geometric, table, induced, layoutTransform Ordering: seriation, attribute Grouping: grouping Metrics: metric Data_type: time, geo, node-attributes, link-attributes, bipartite Expressions: expressions Visual Mapping: scale, labelOcclusion, color, parallel-links, linkPath, shape, nesting, glyphs Interaction: parameters, highlight, panAndZoom, fixedLabels, tooltips, selections Visualization Design
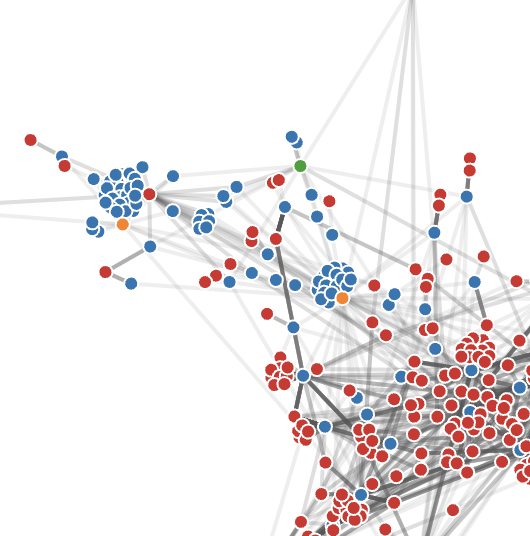
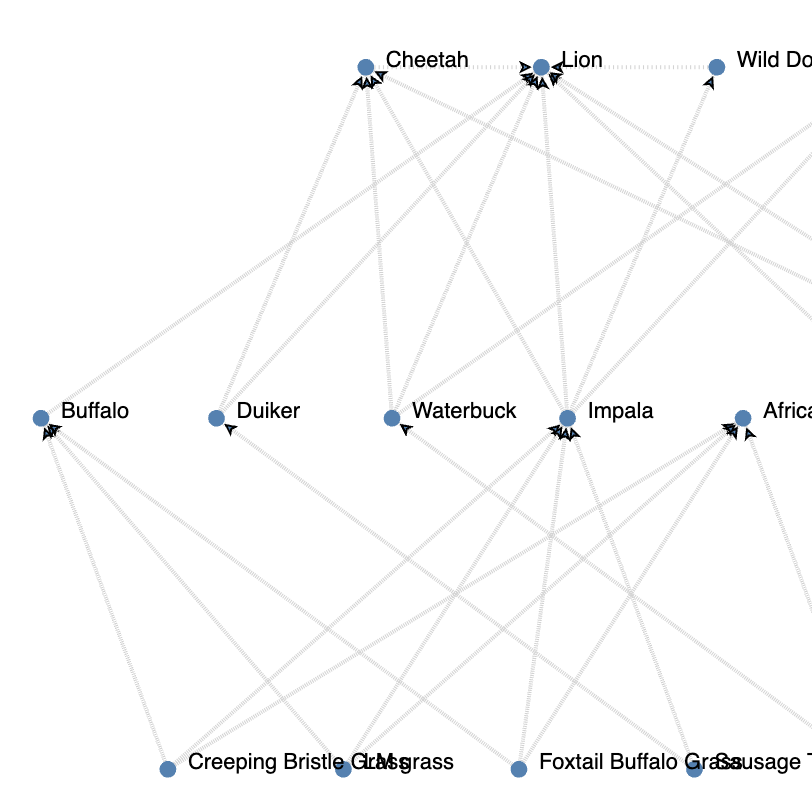
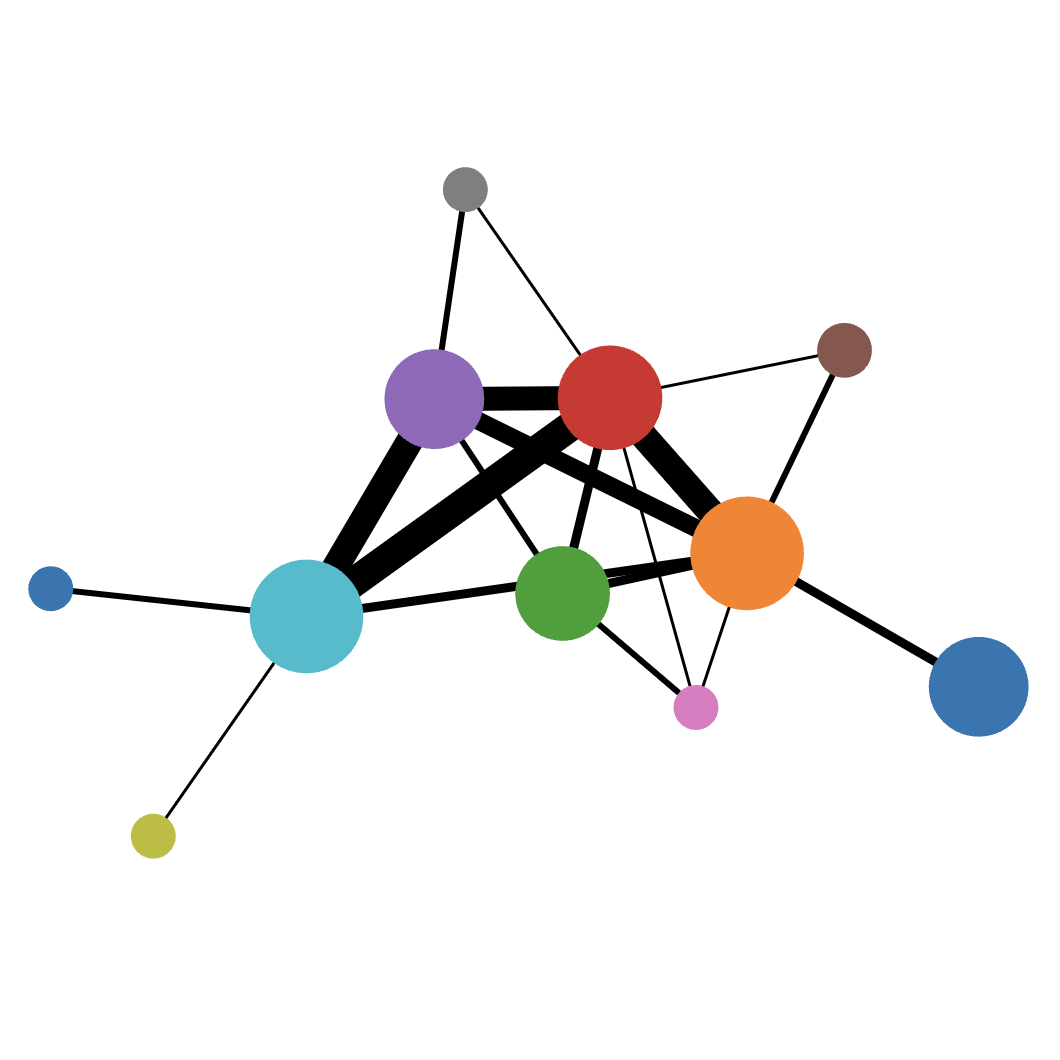
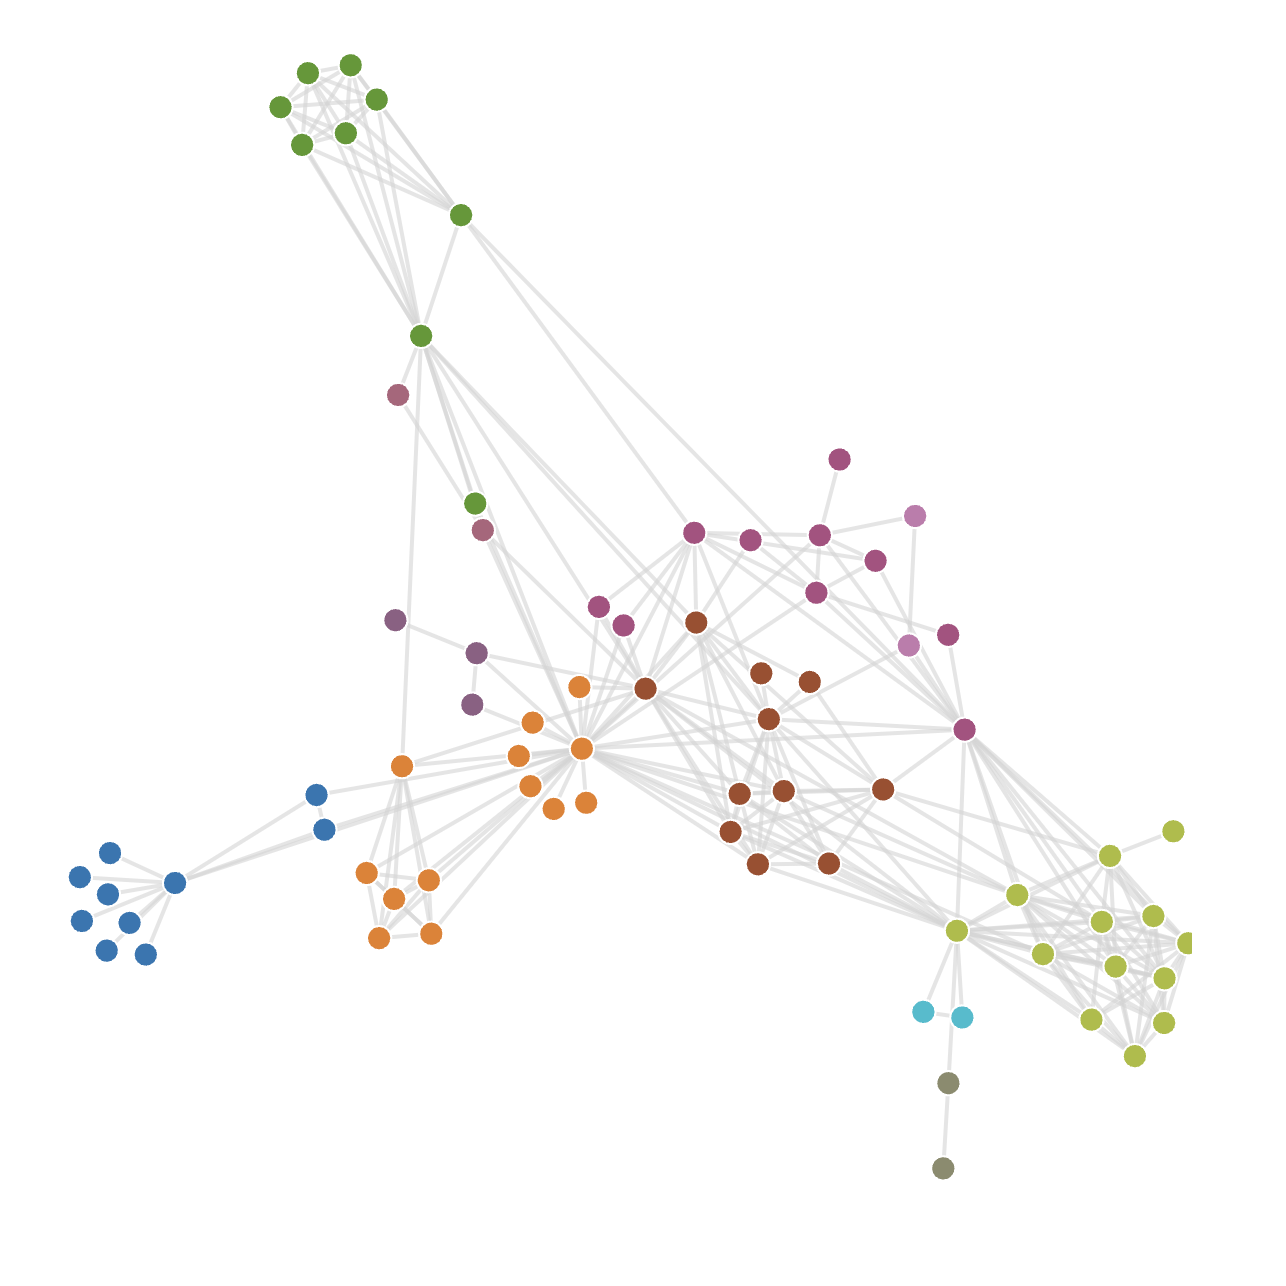
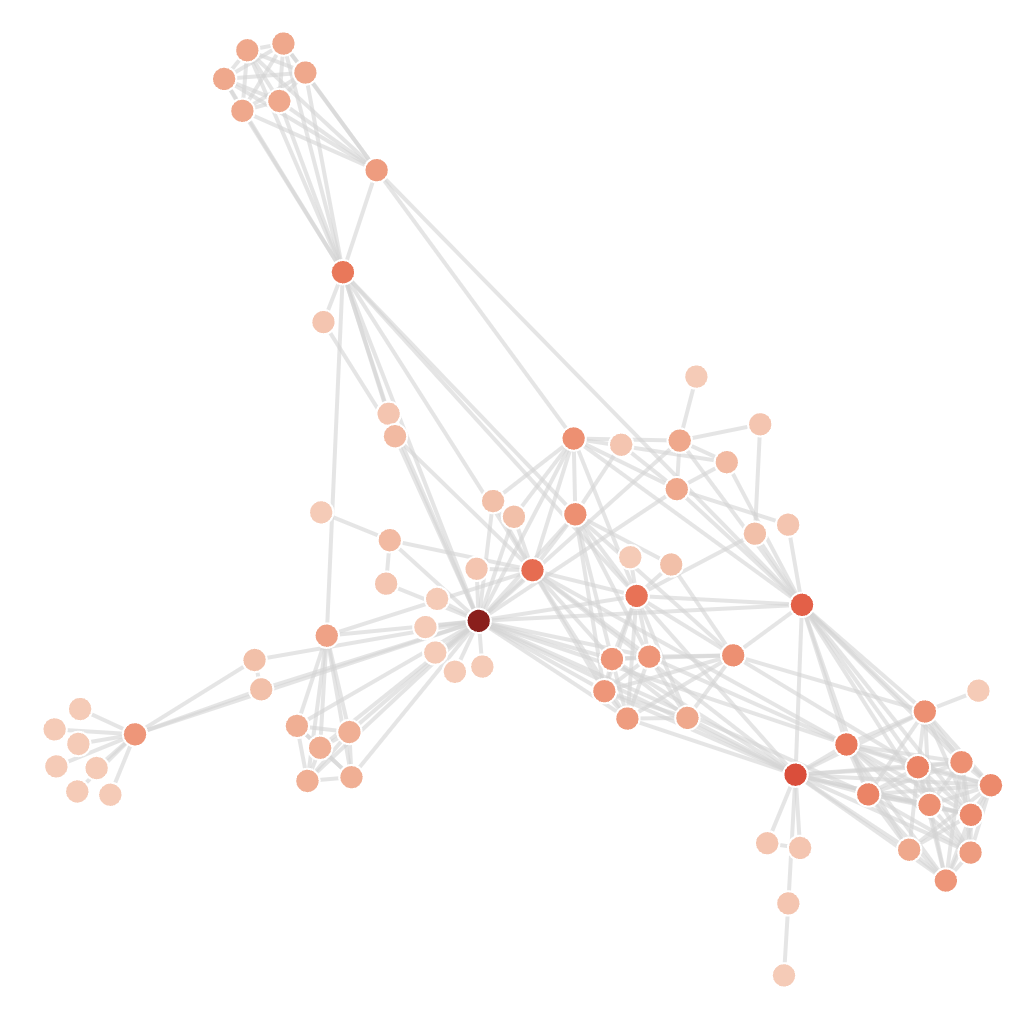
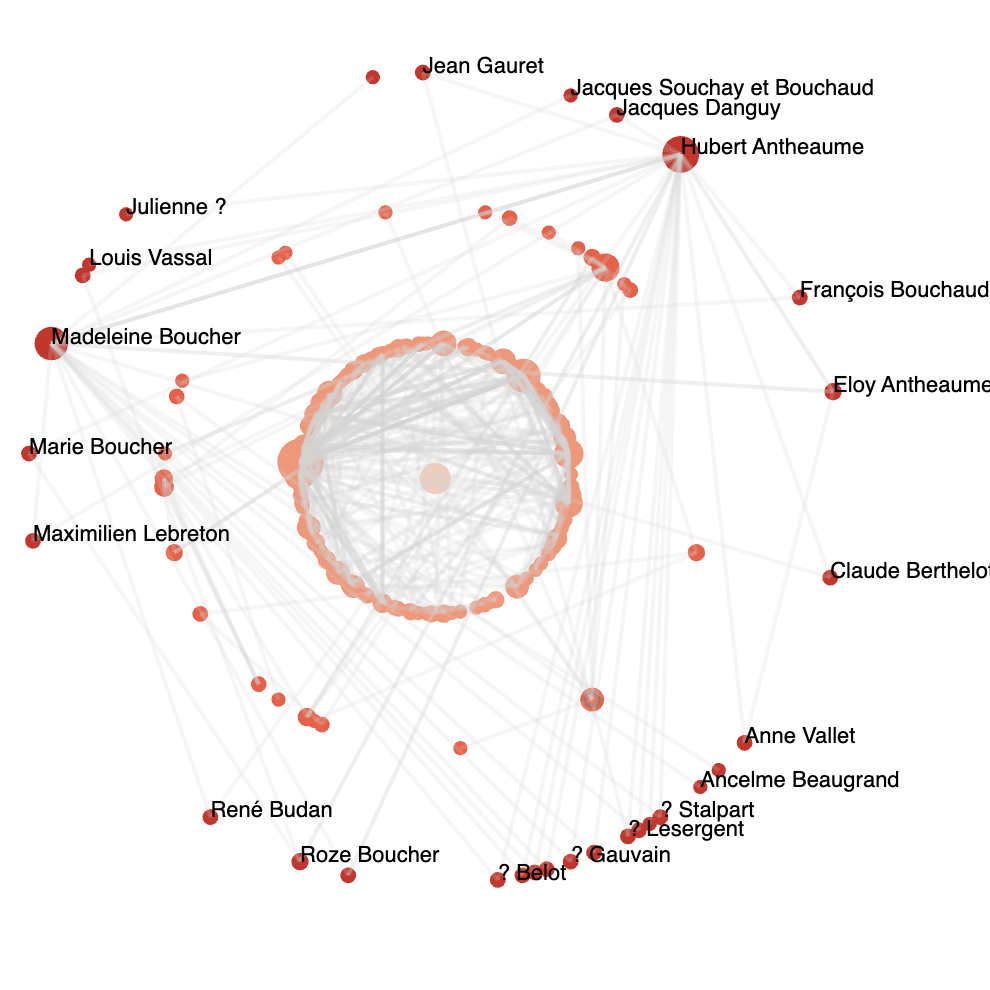
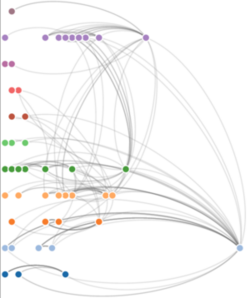
Node-link
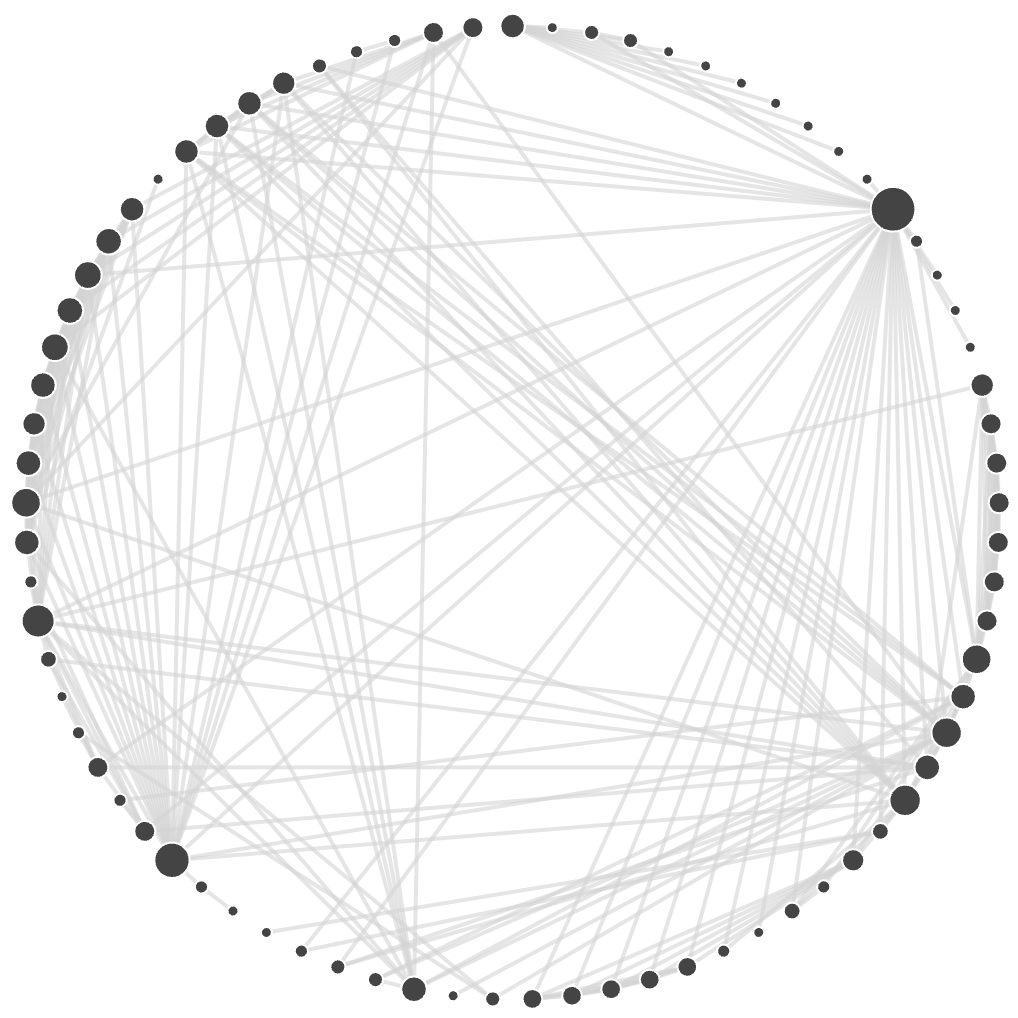
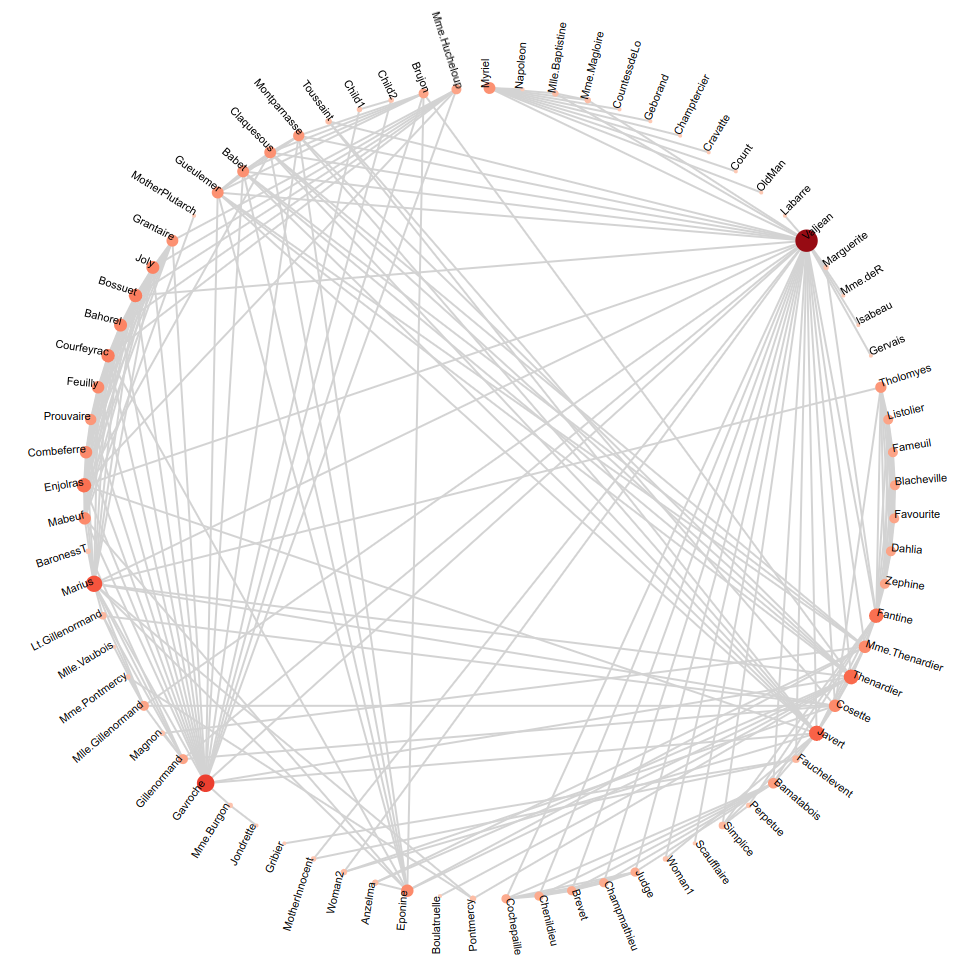
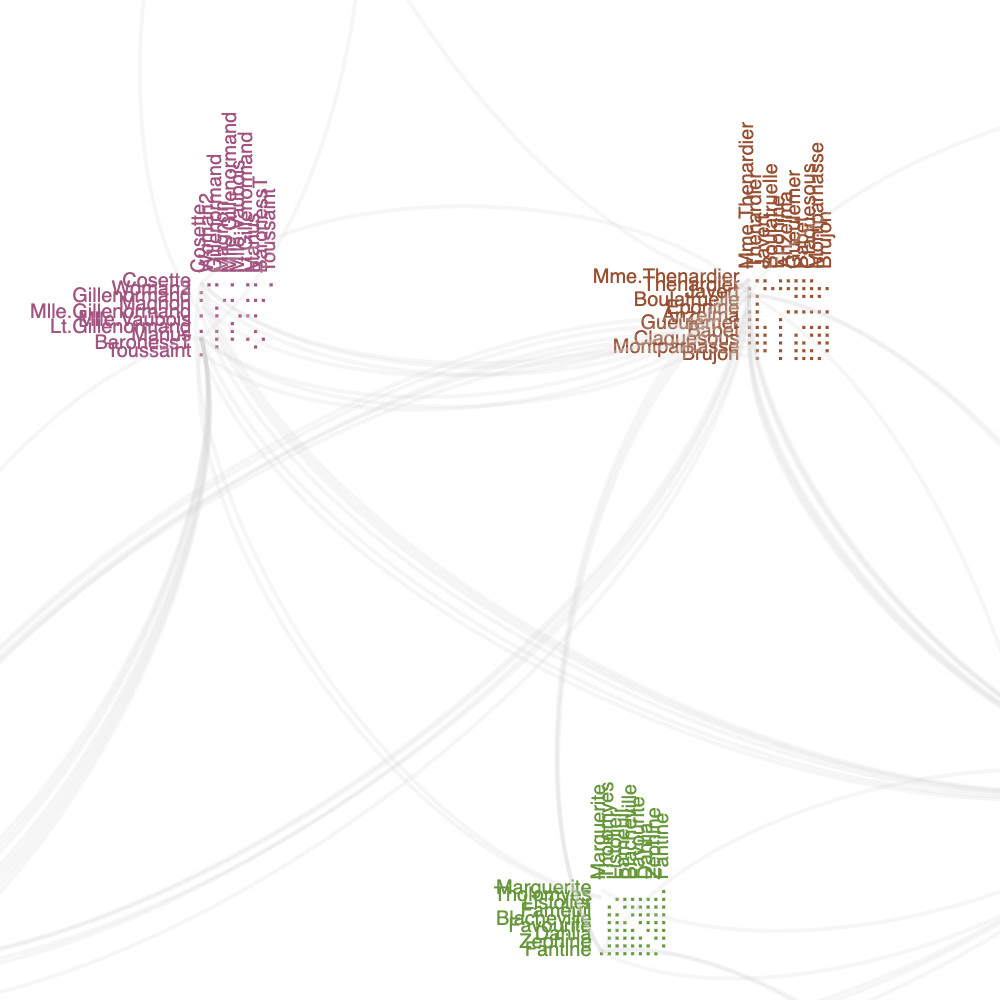
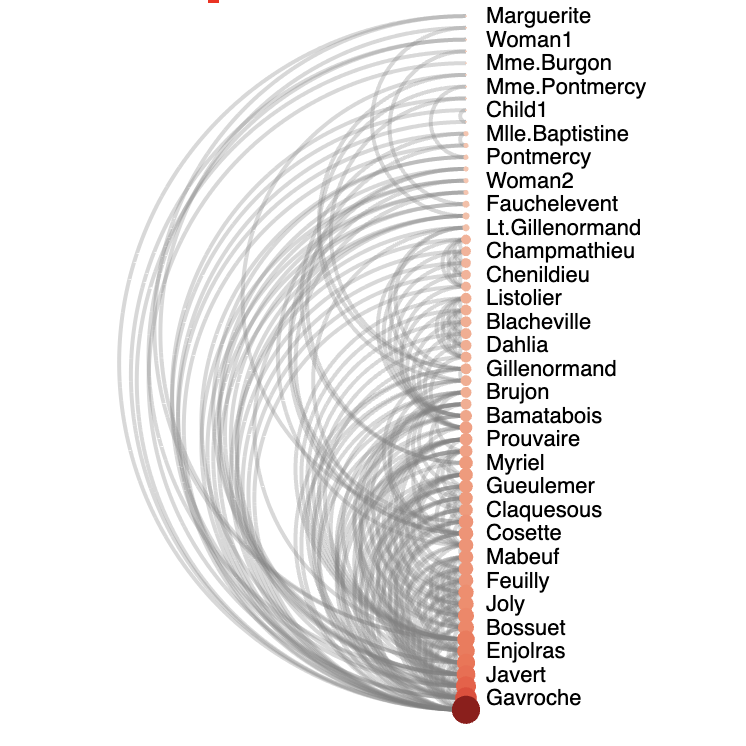
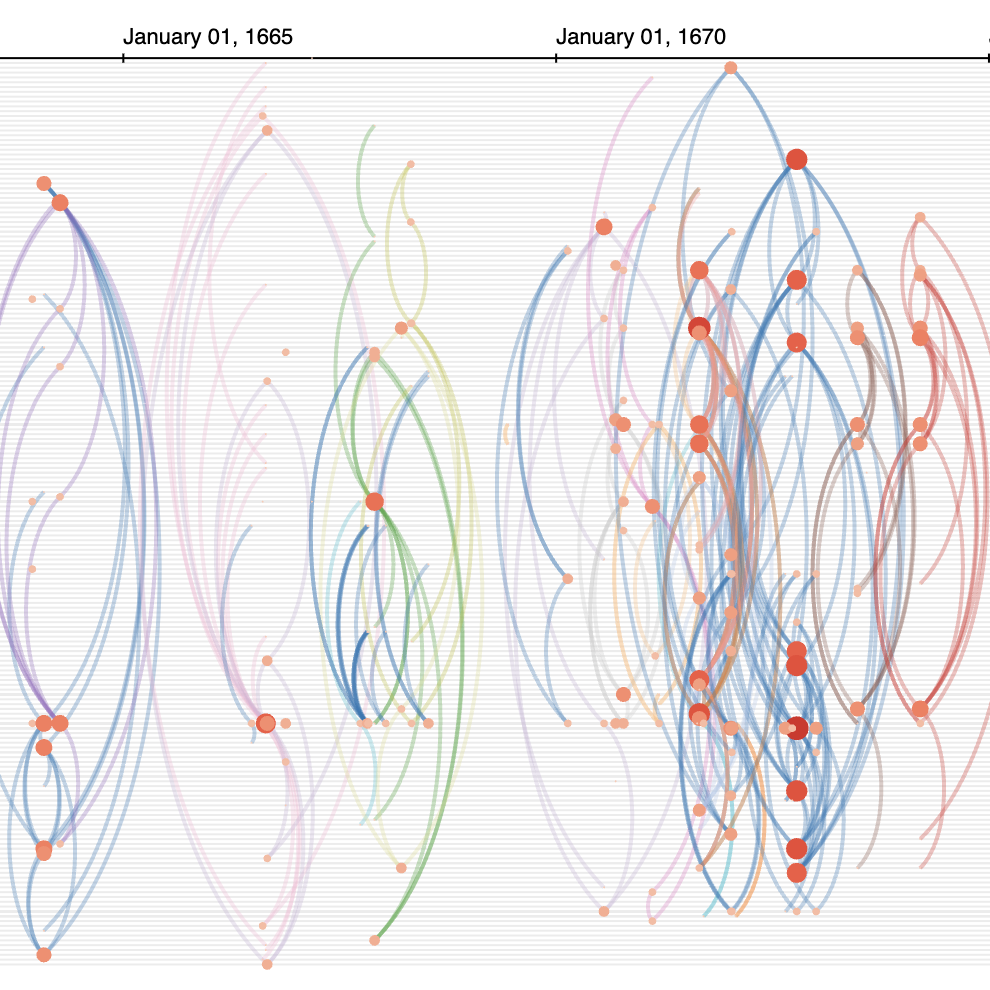
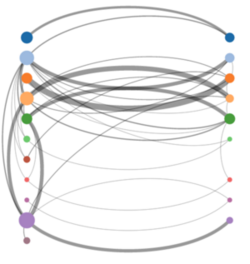
Arc-diagram
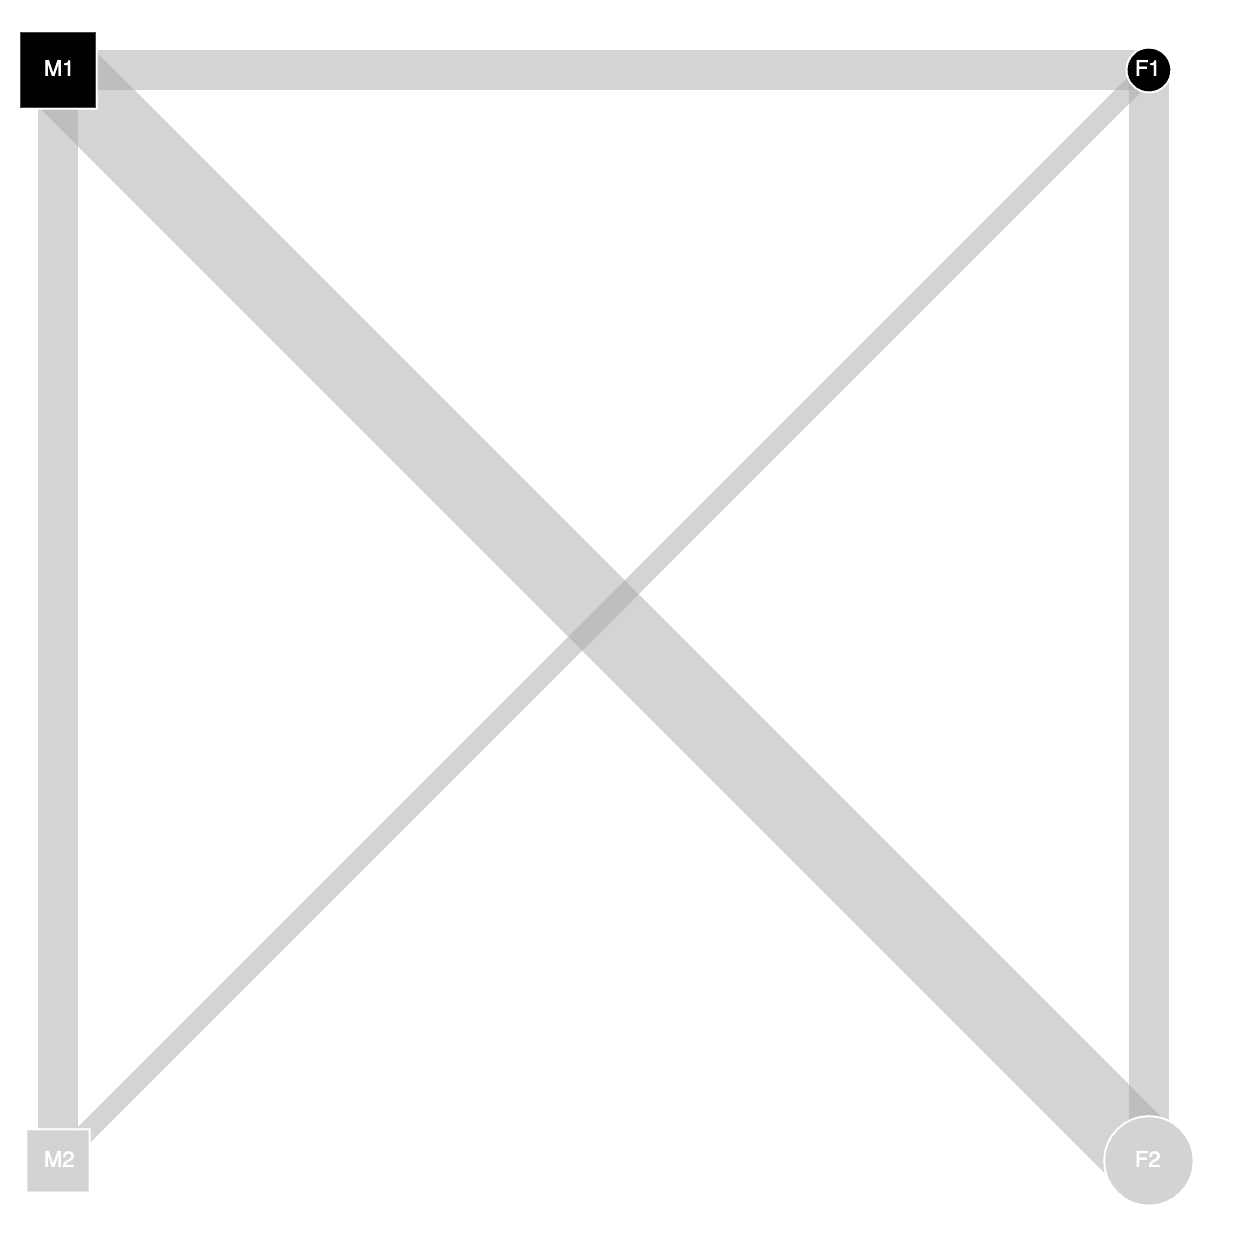
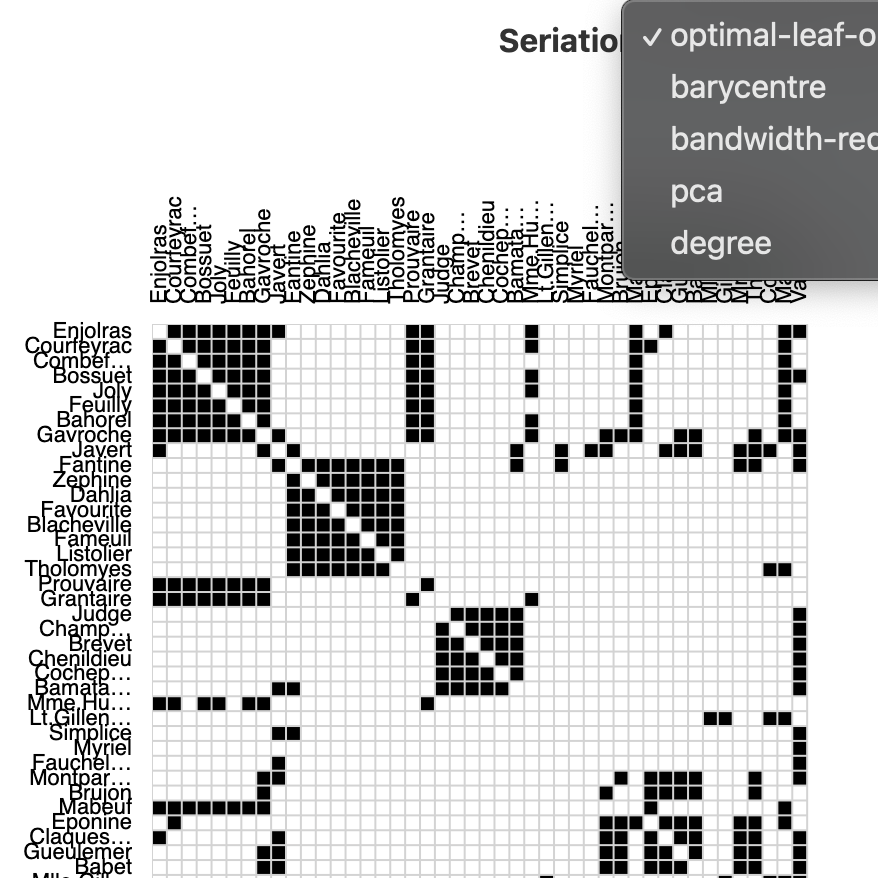
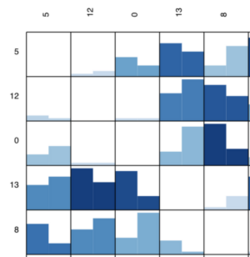
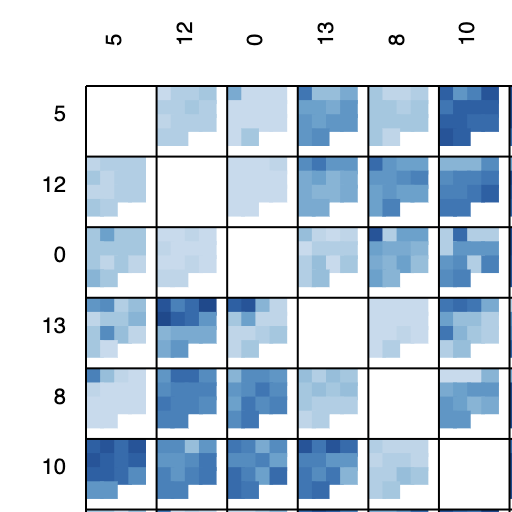
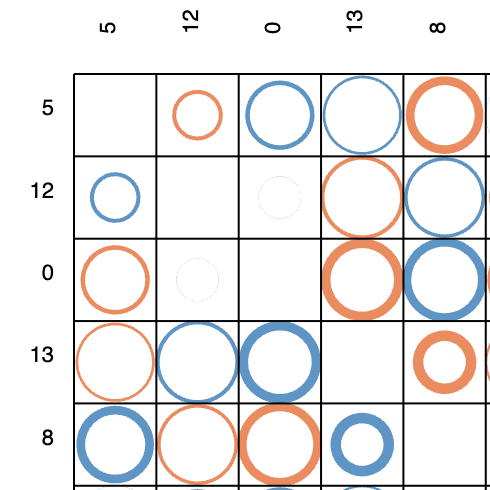
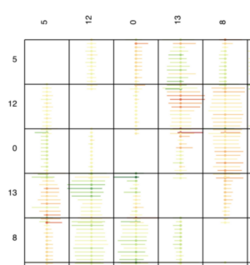
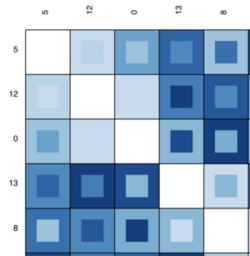
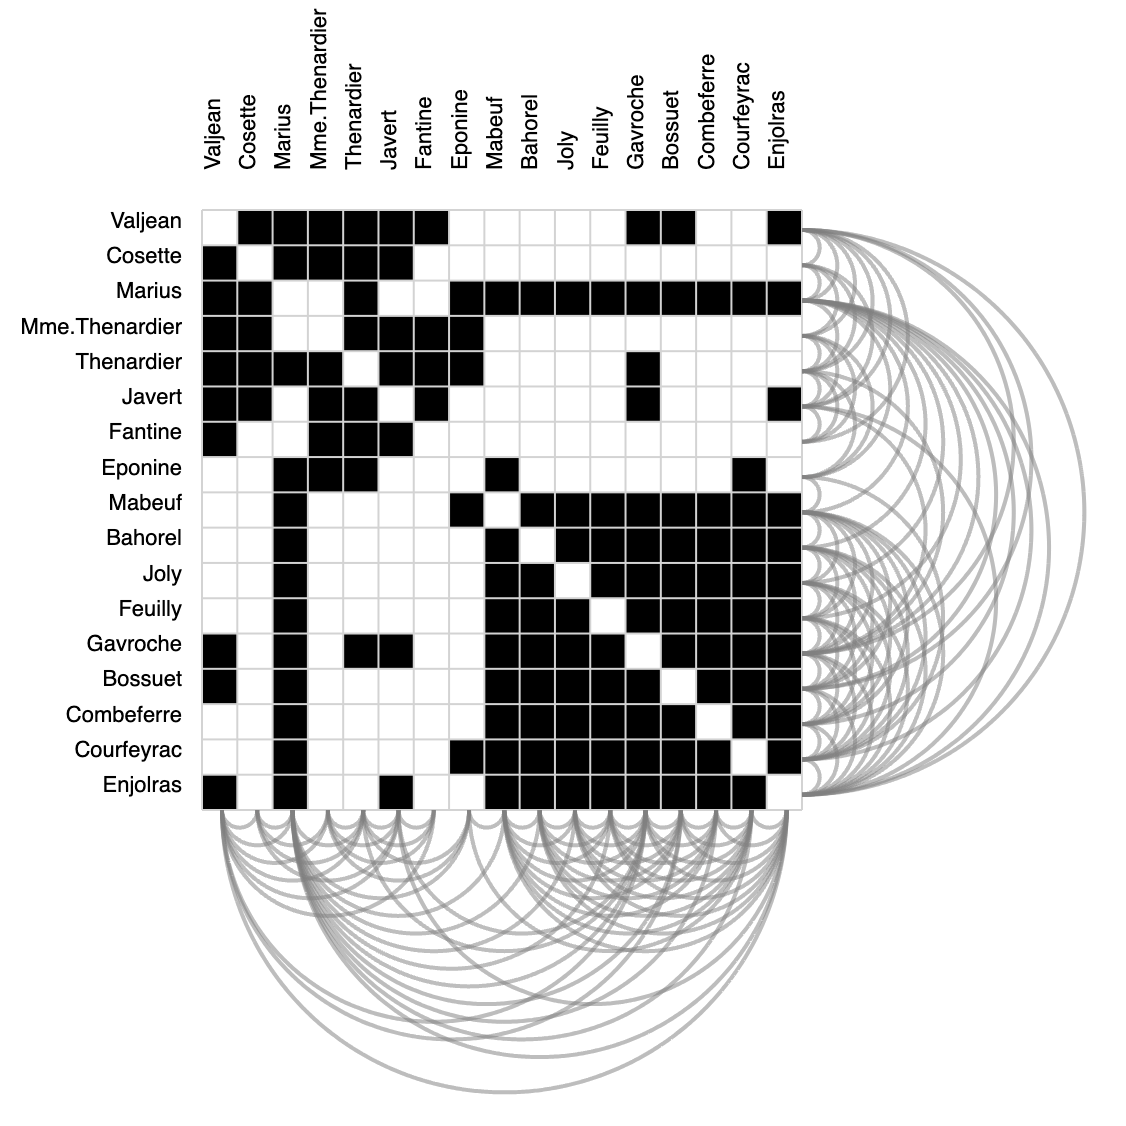
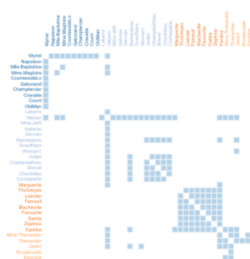
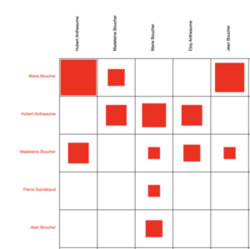
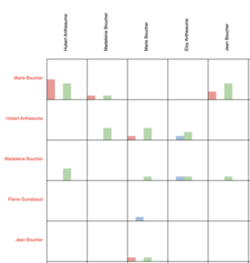
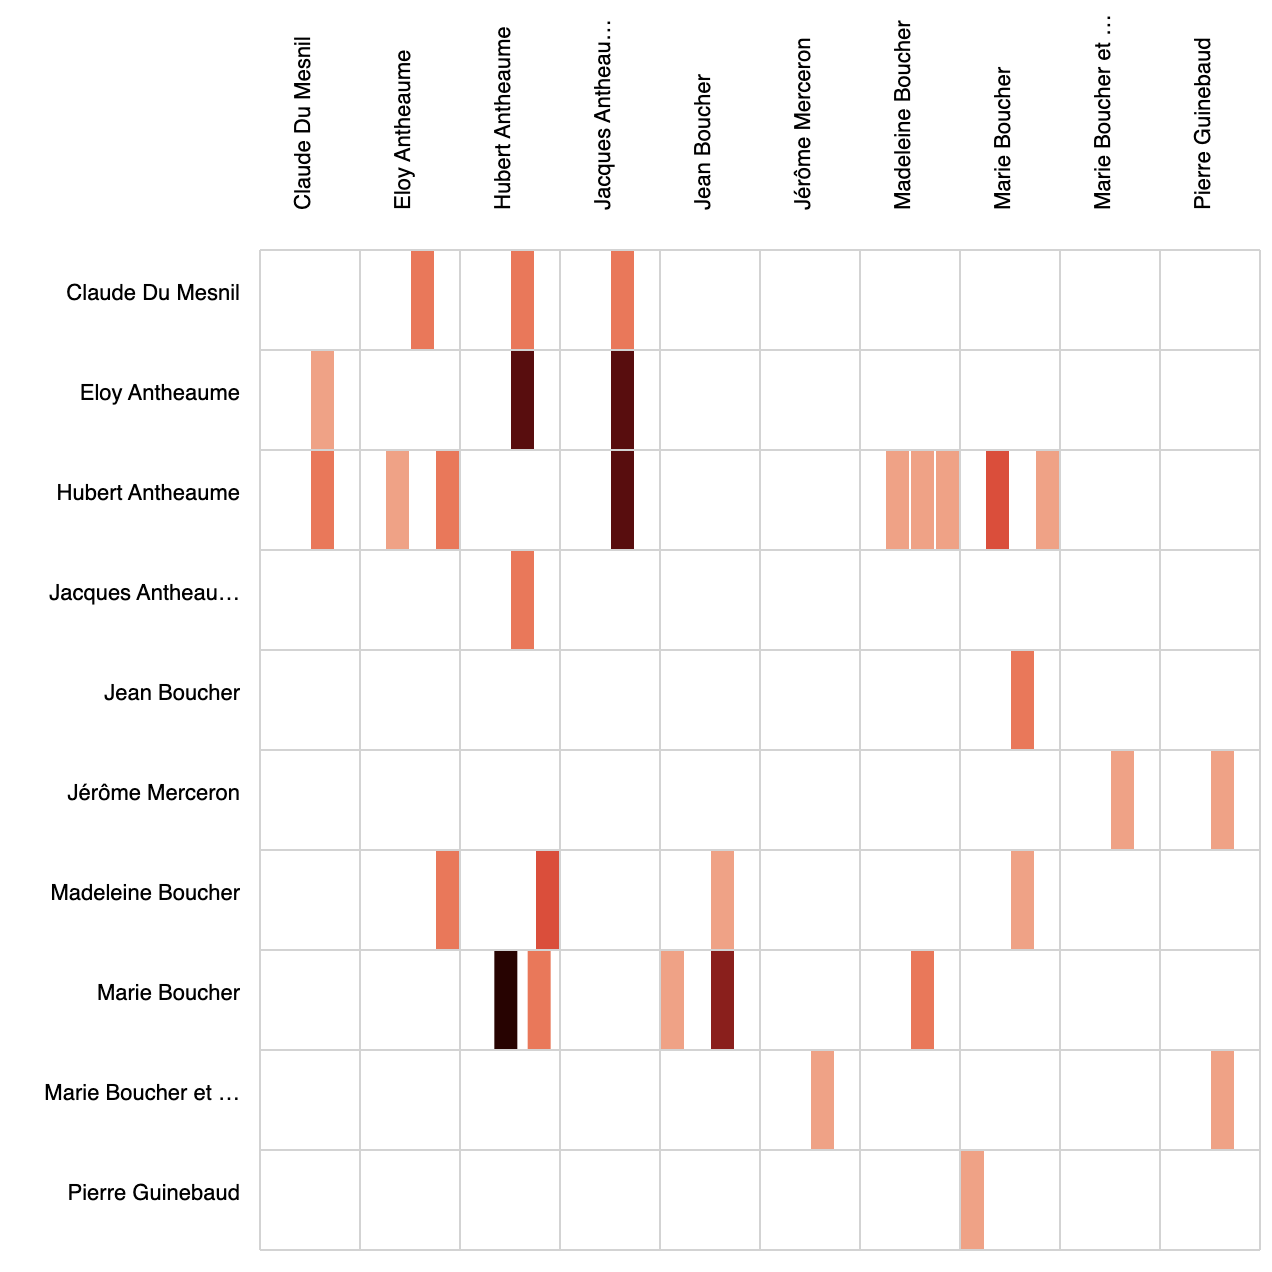
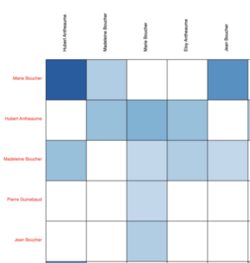
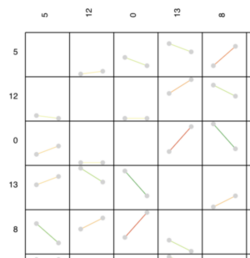
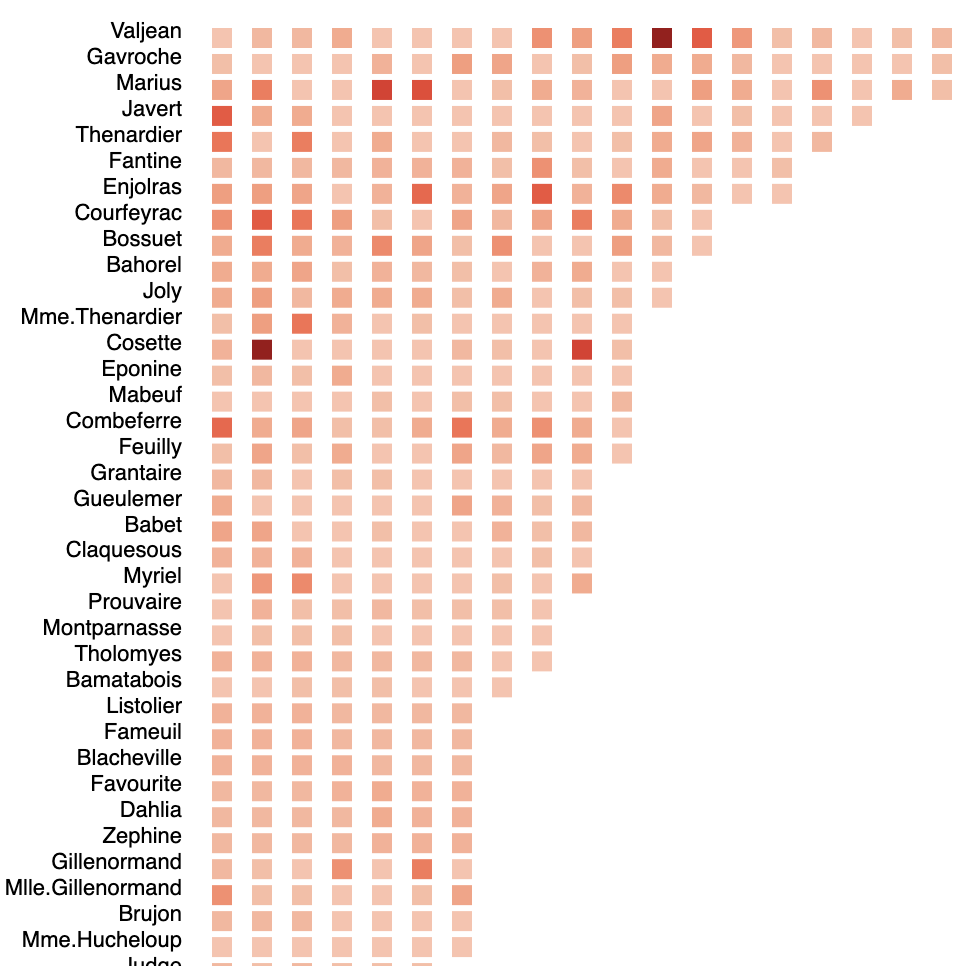
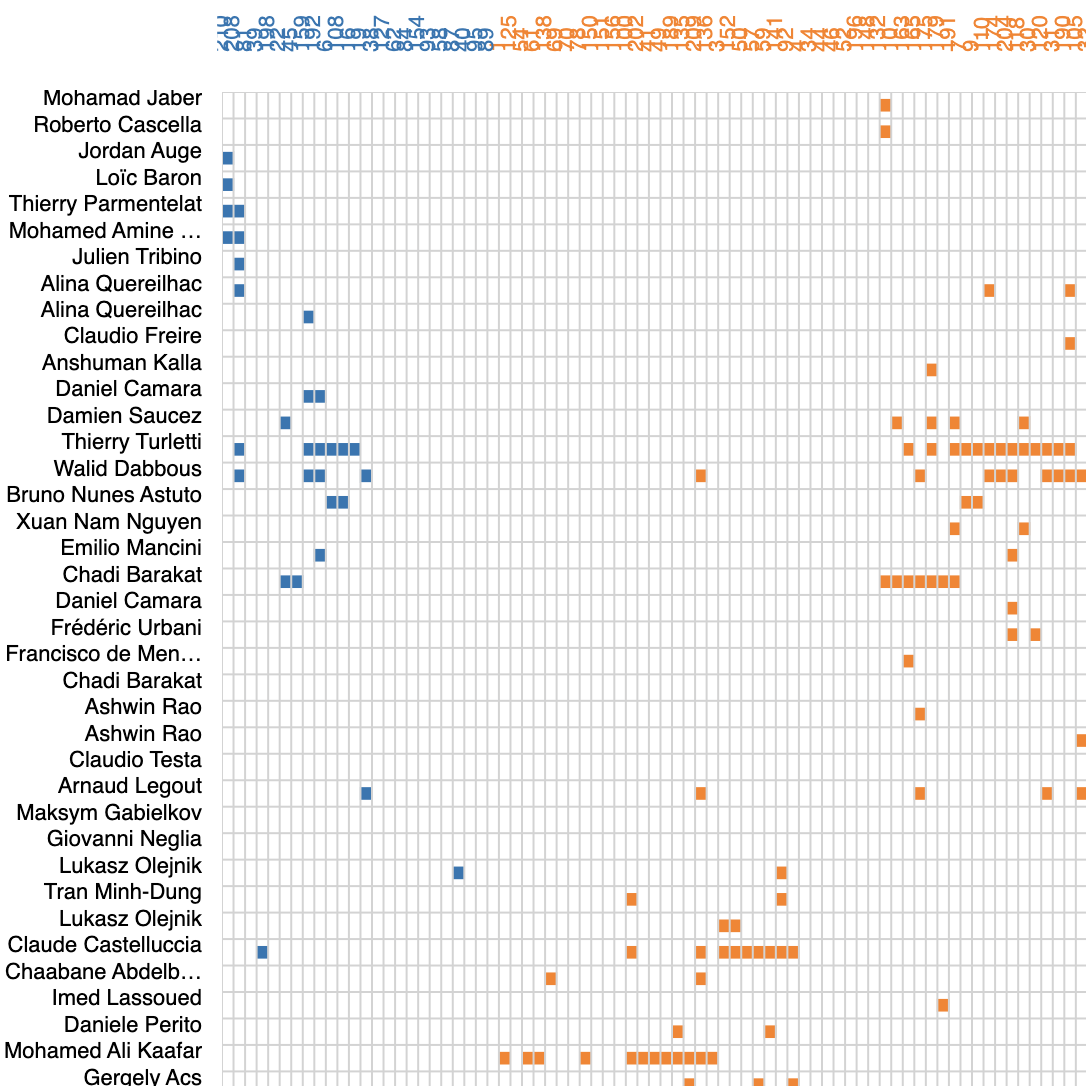
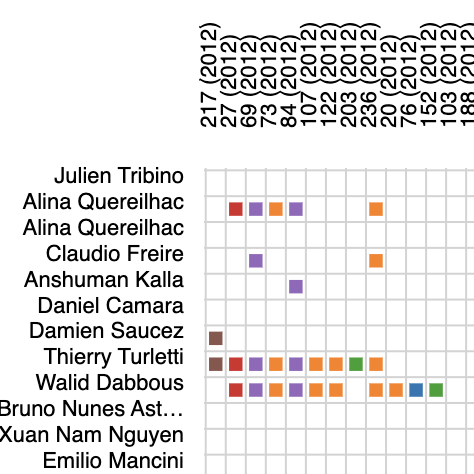
Matrix
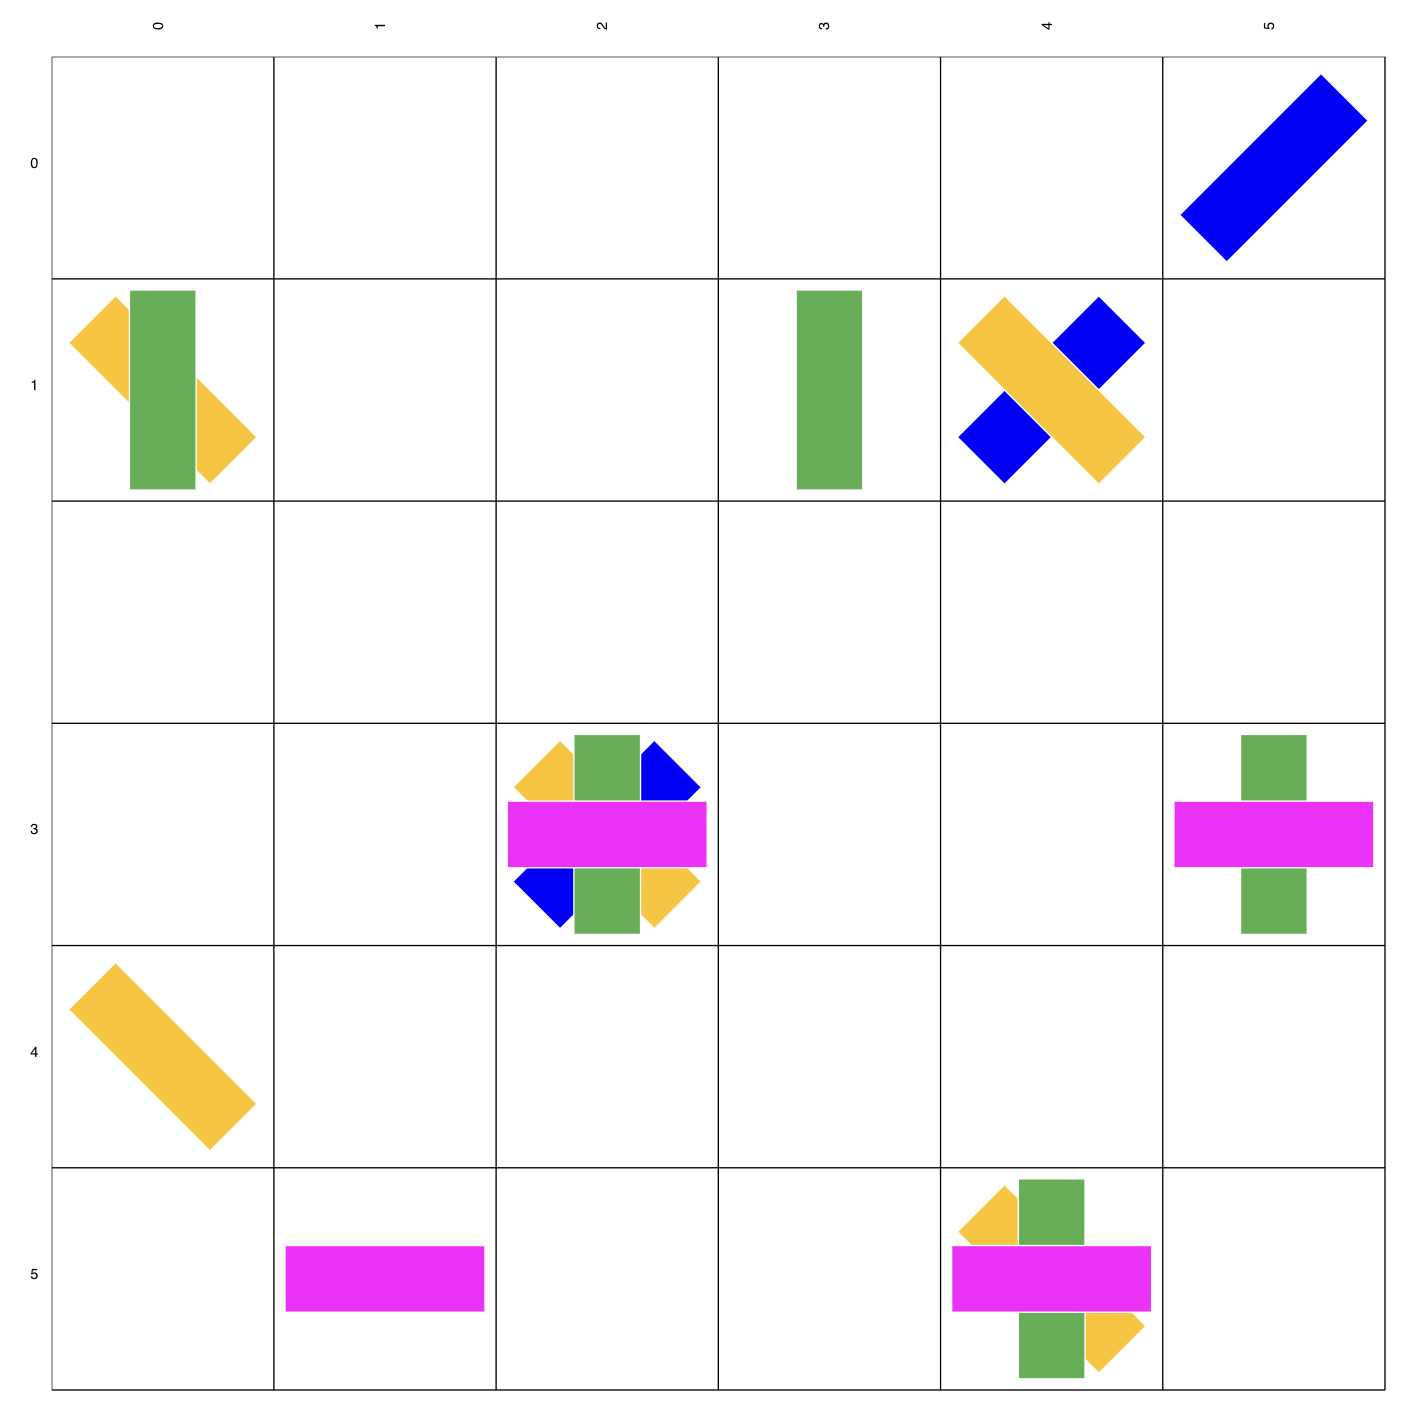
Jigsaw
Hybrid
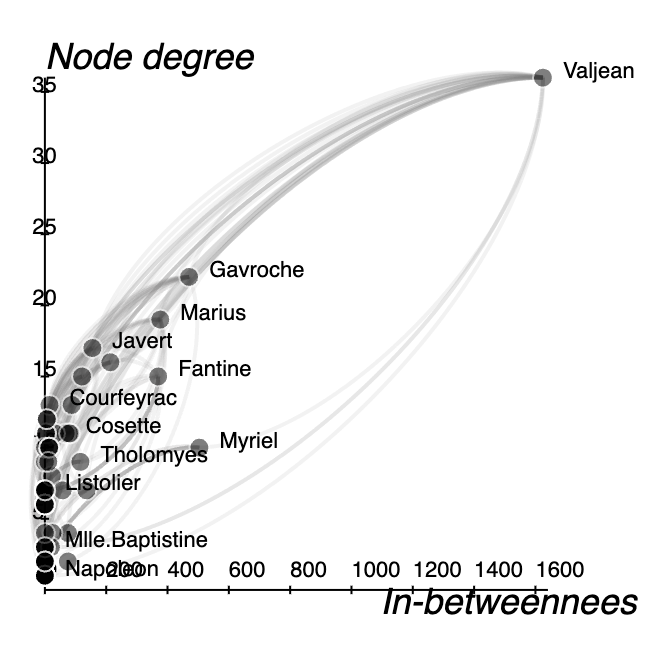
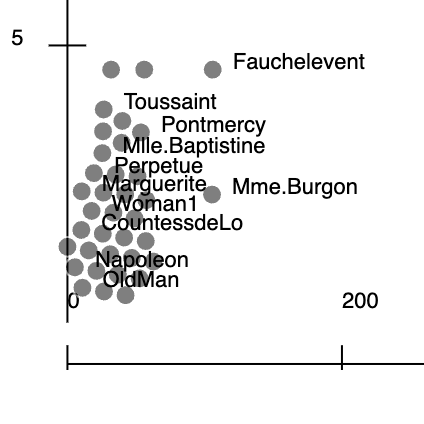
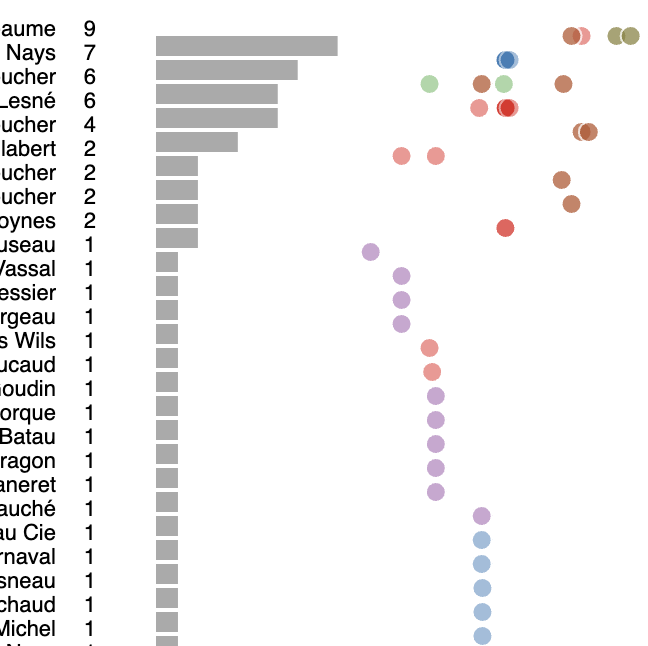
Scatterplot
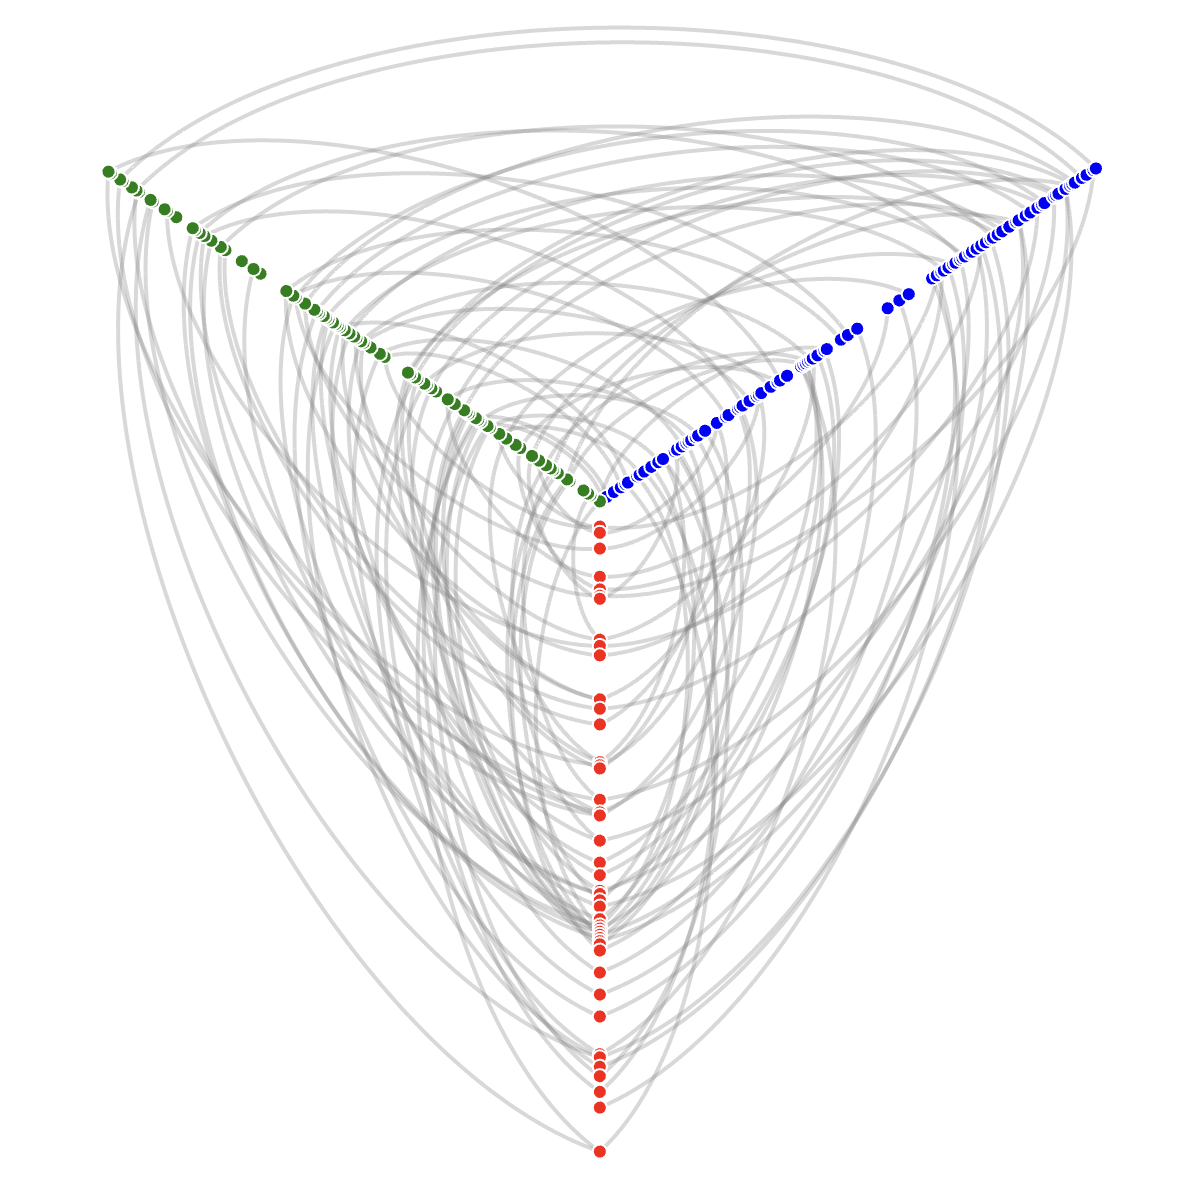
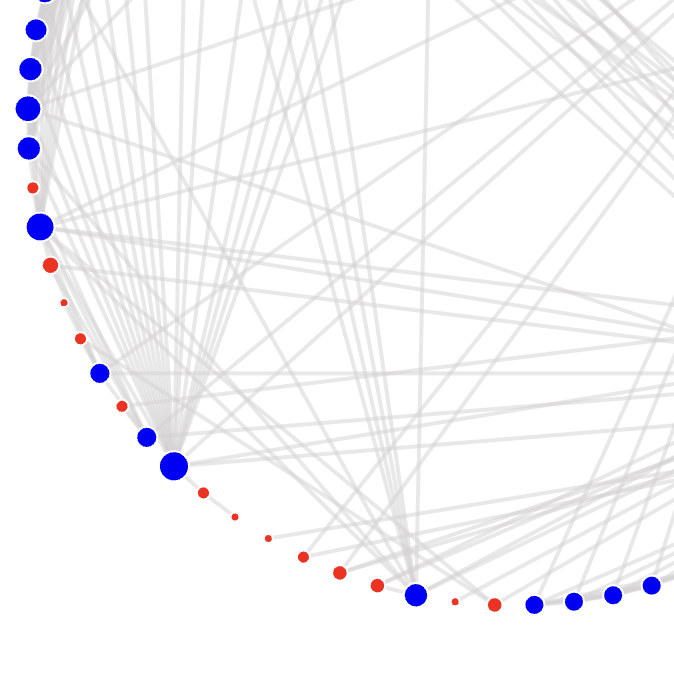
Hiveplot
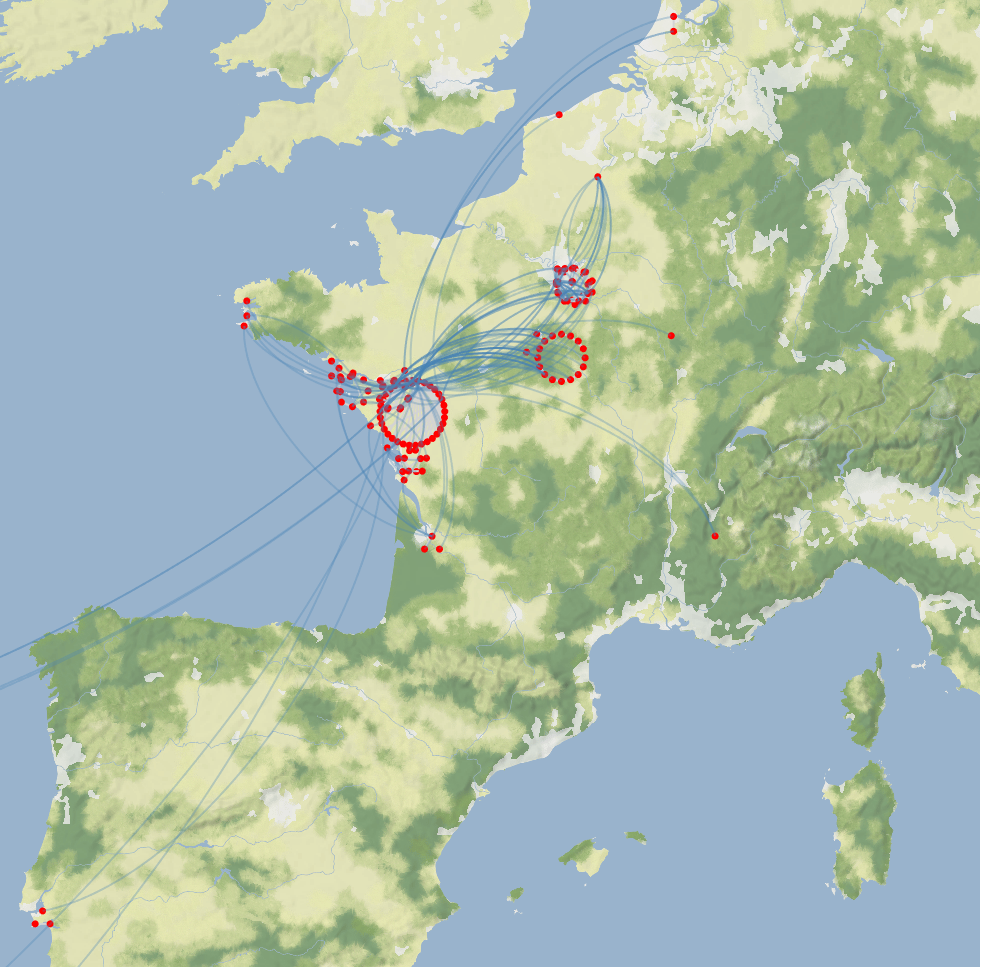
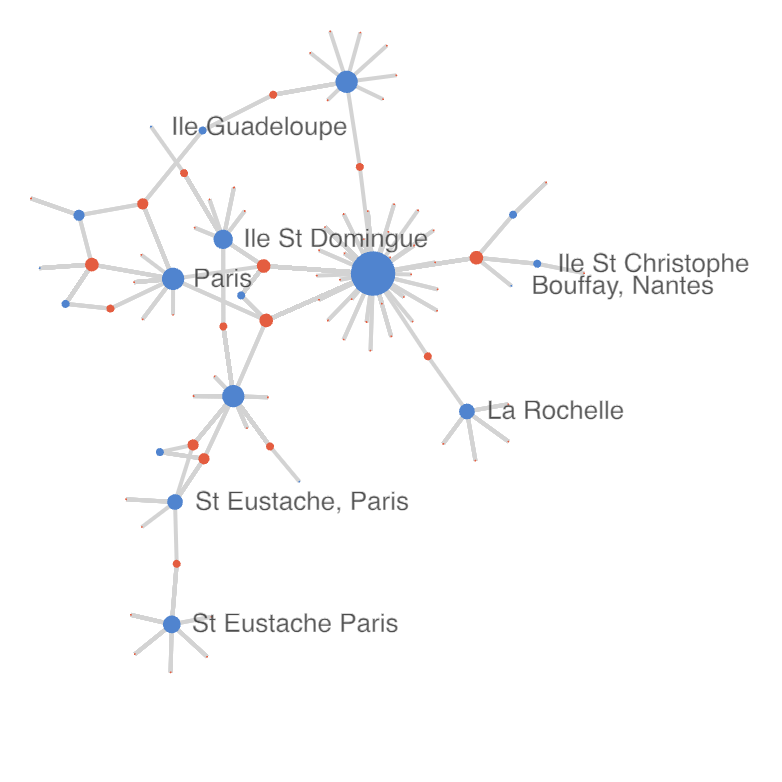
Map
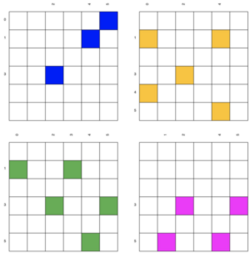
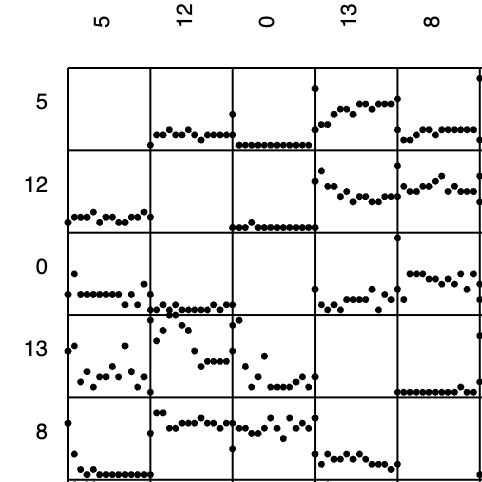
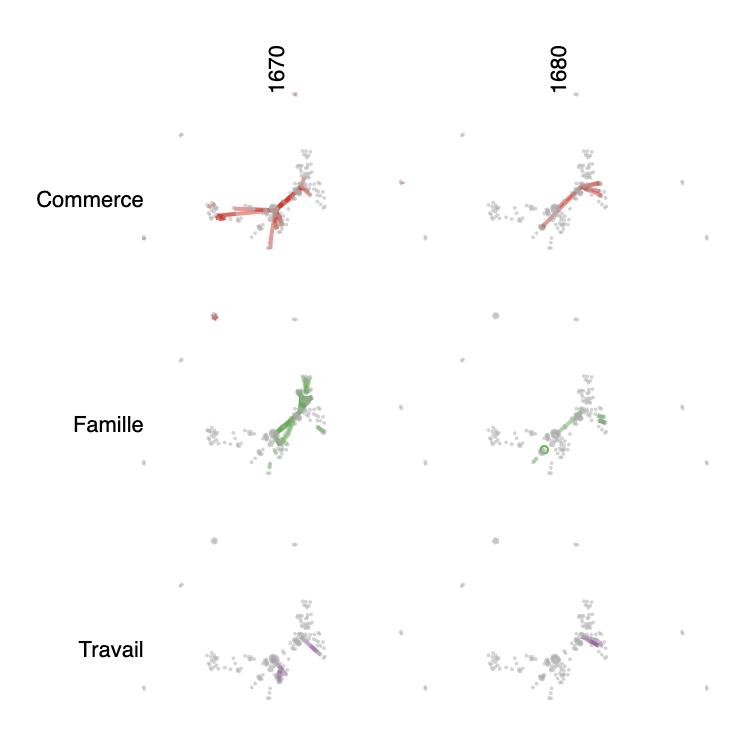
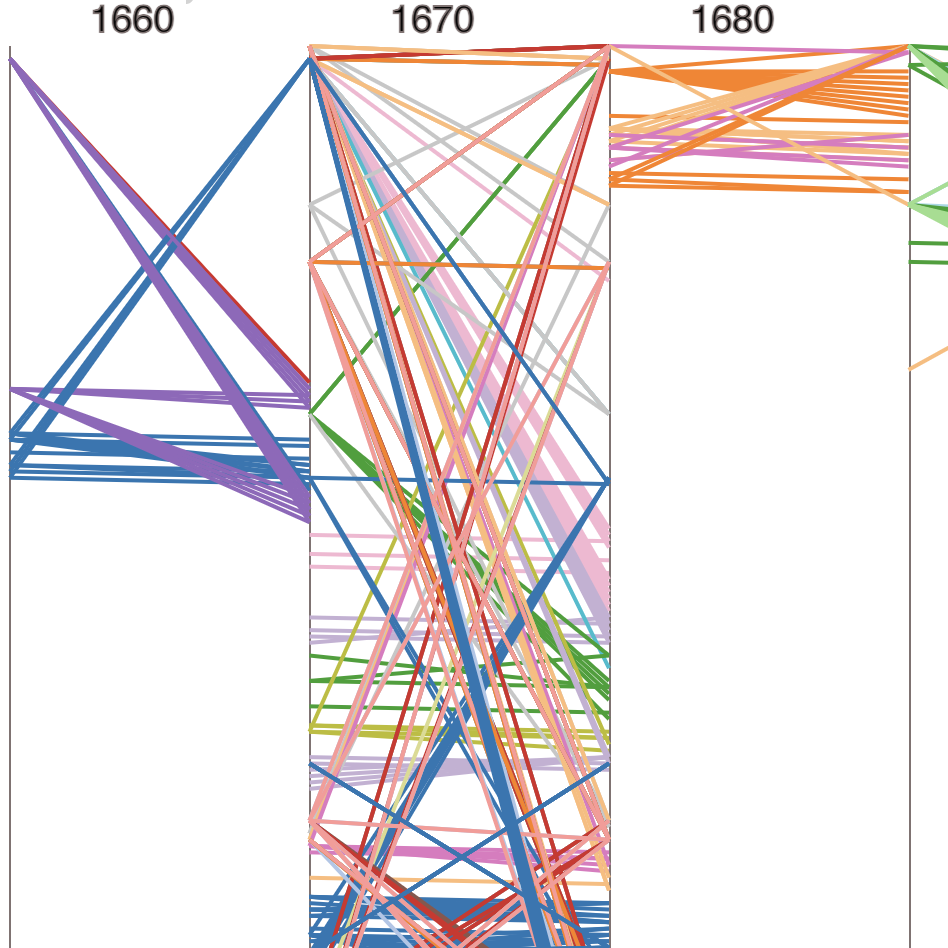
Small-multiples
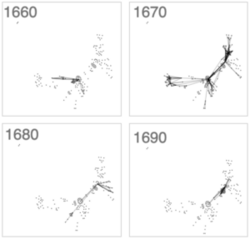
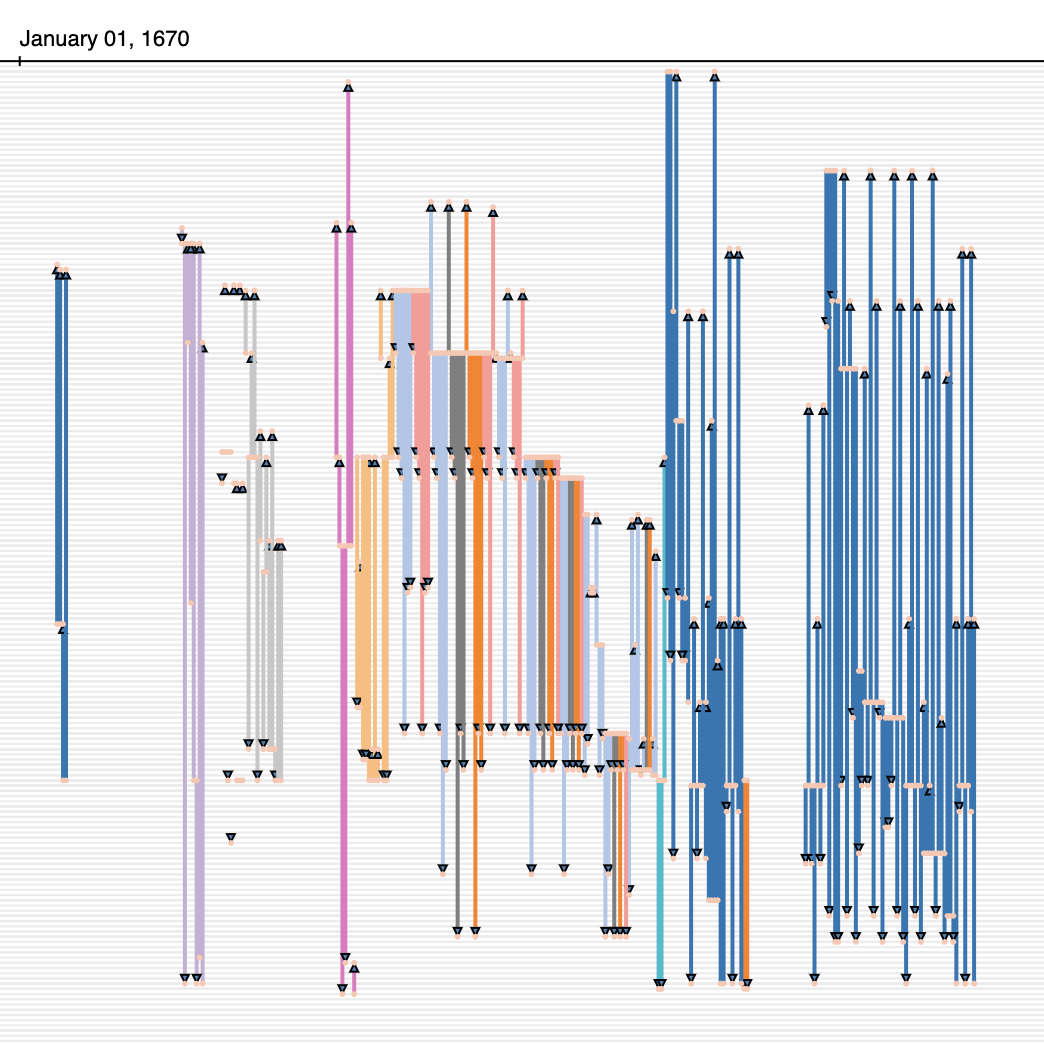
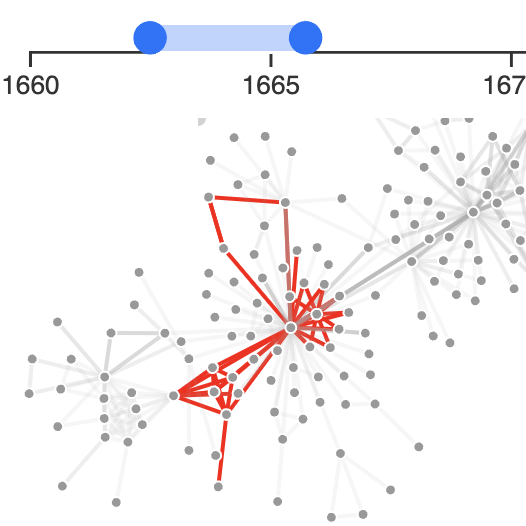
Timeline
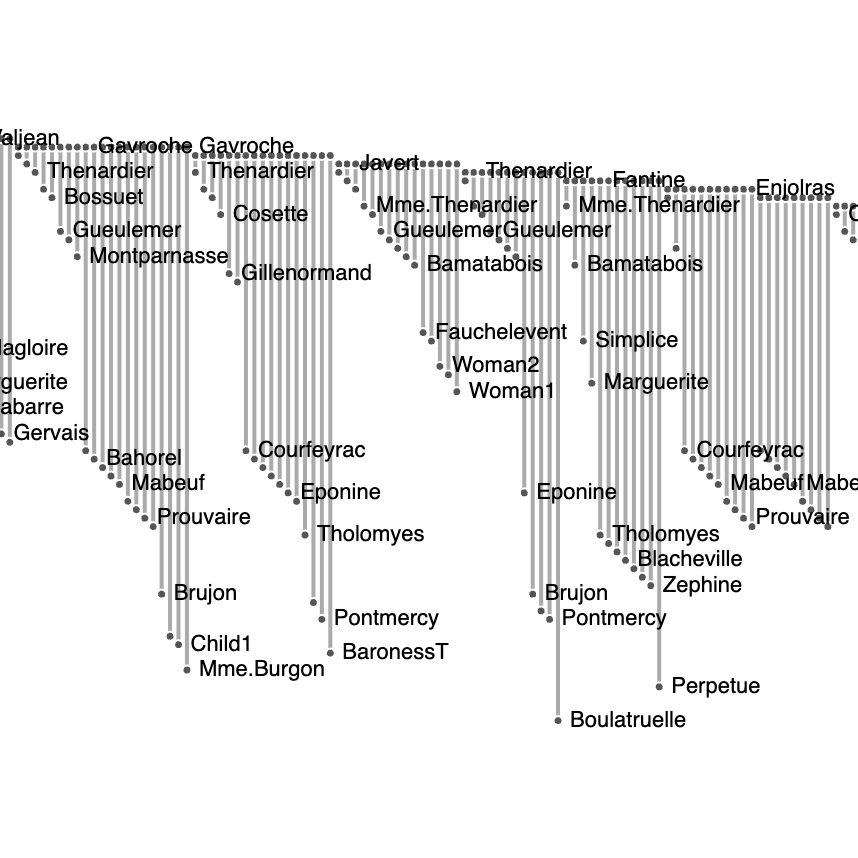
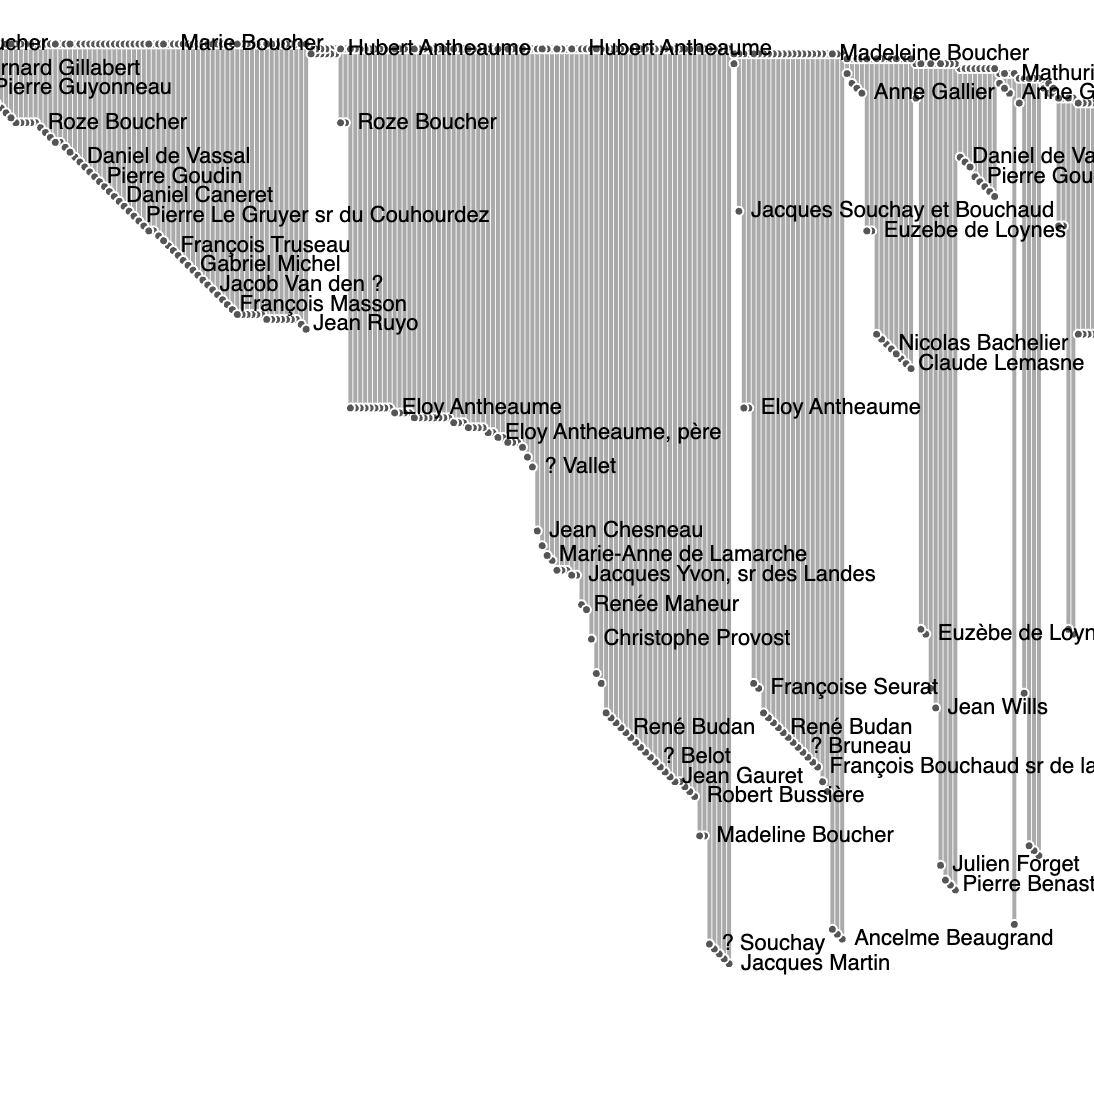
Adjacency-list
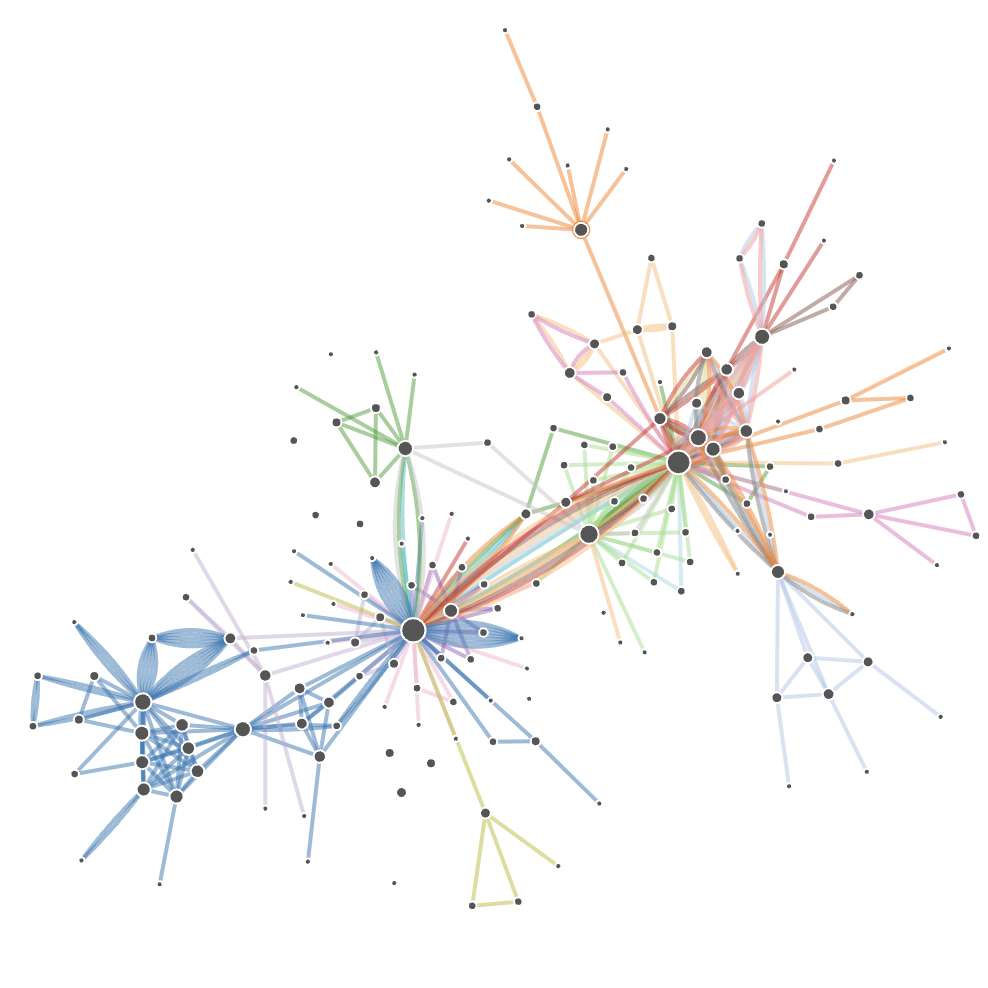
Parallel-edges
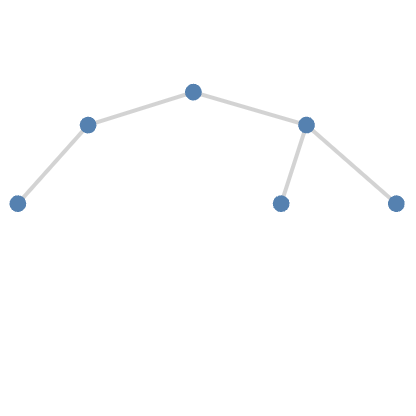
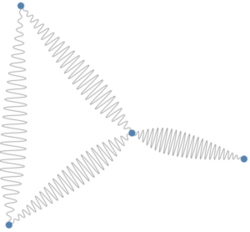
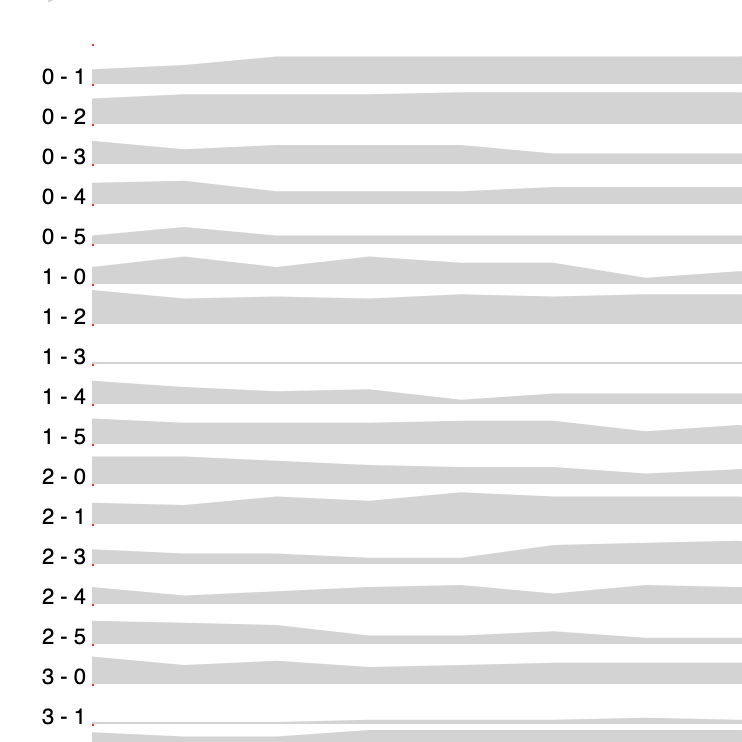
Link-wave
Data Import
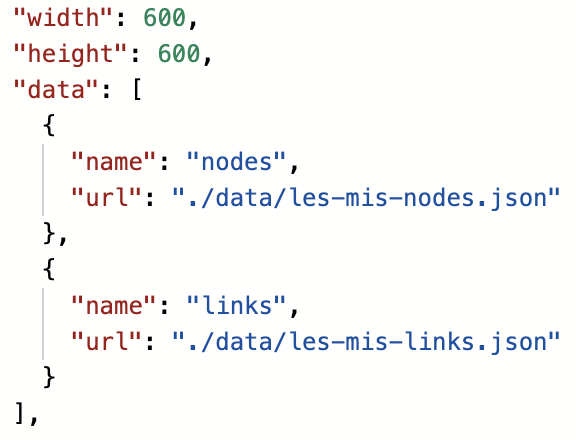
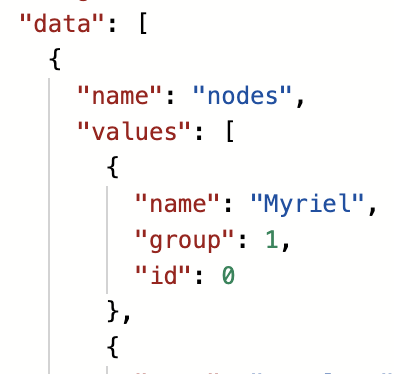
Json
Csv
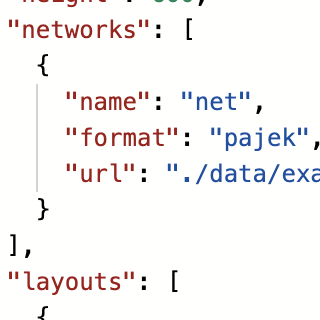
Pajek
Inline
Multiple-tables
Network
Yield Nodes
Yield Links
Filter Nodes
Filter Edges
Aggregate Nodes
Aggregate Edges
Remove Isolated
Connect
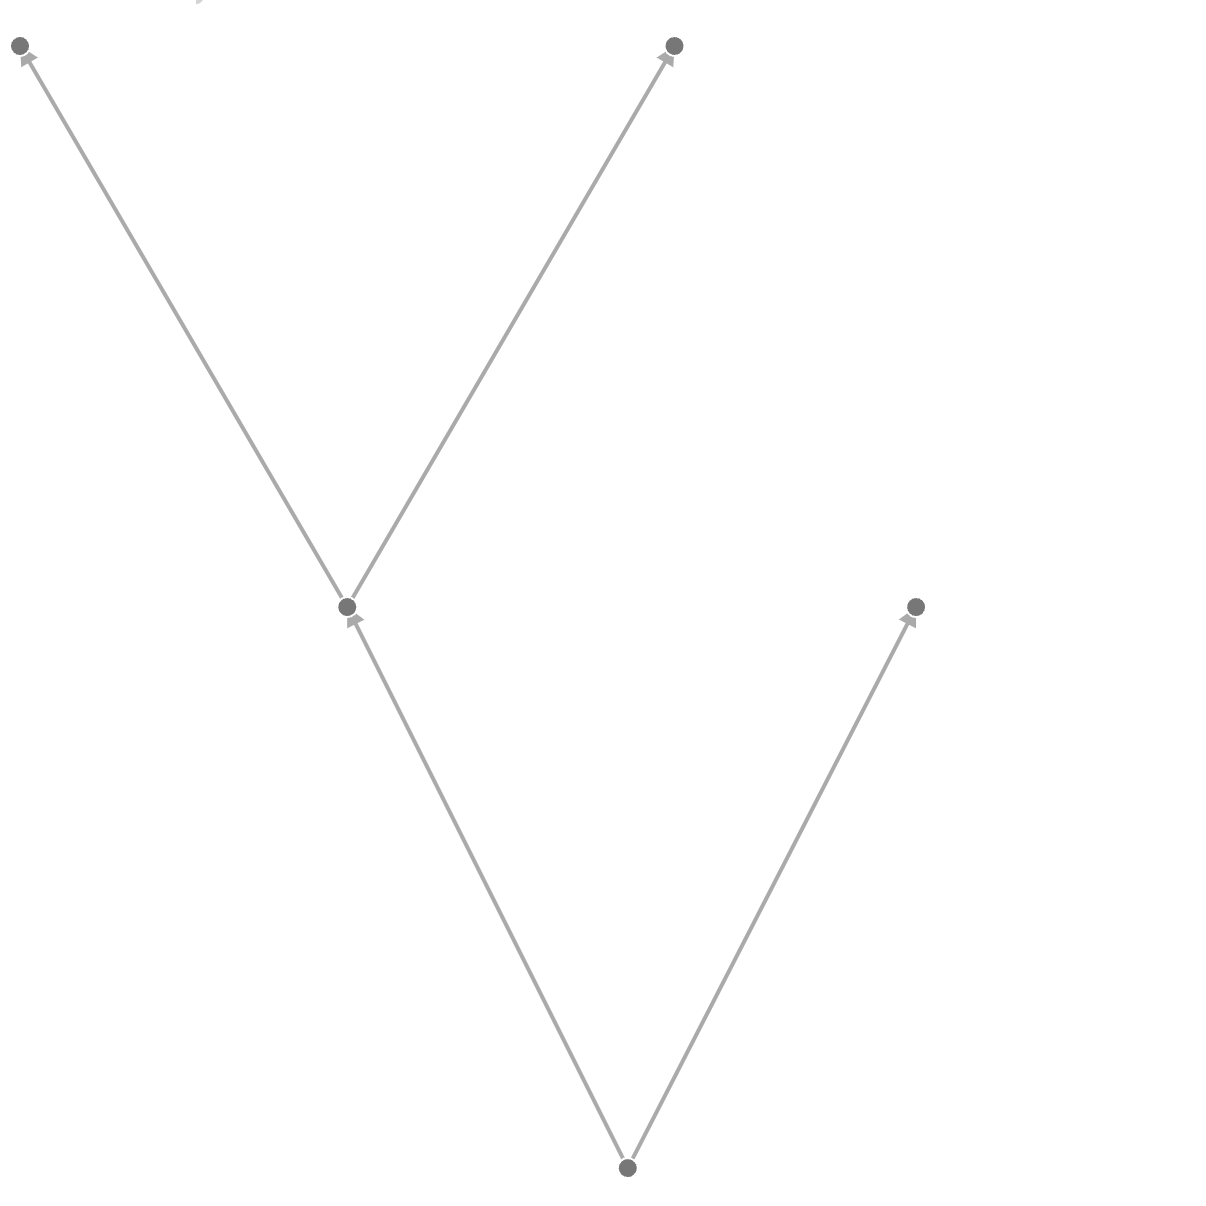
Reverse Edges
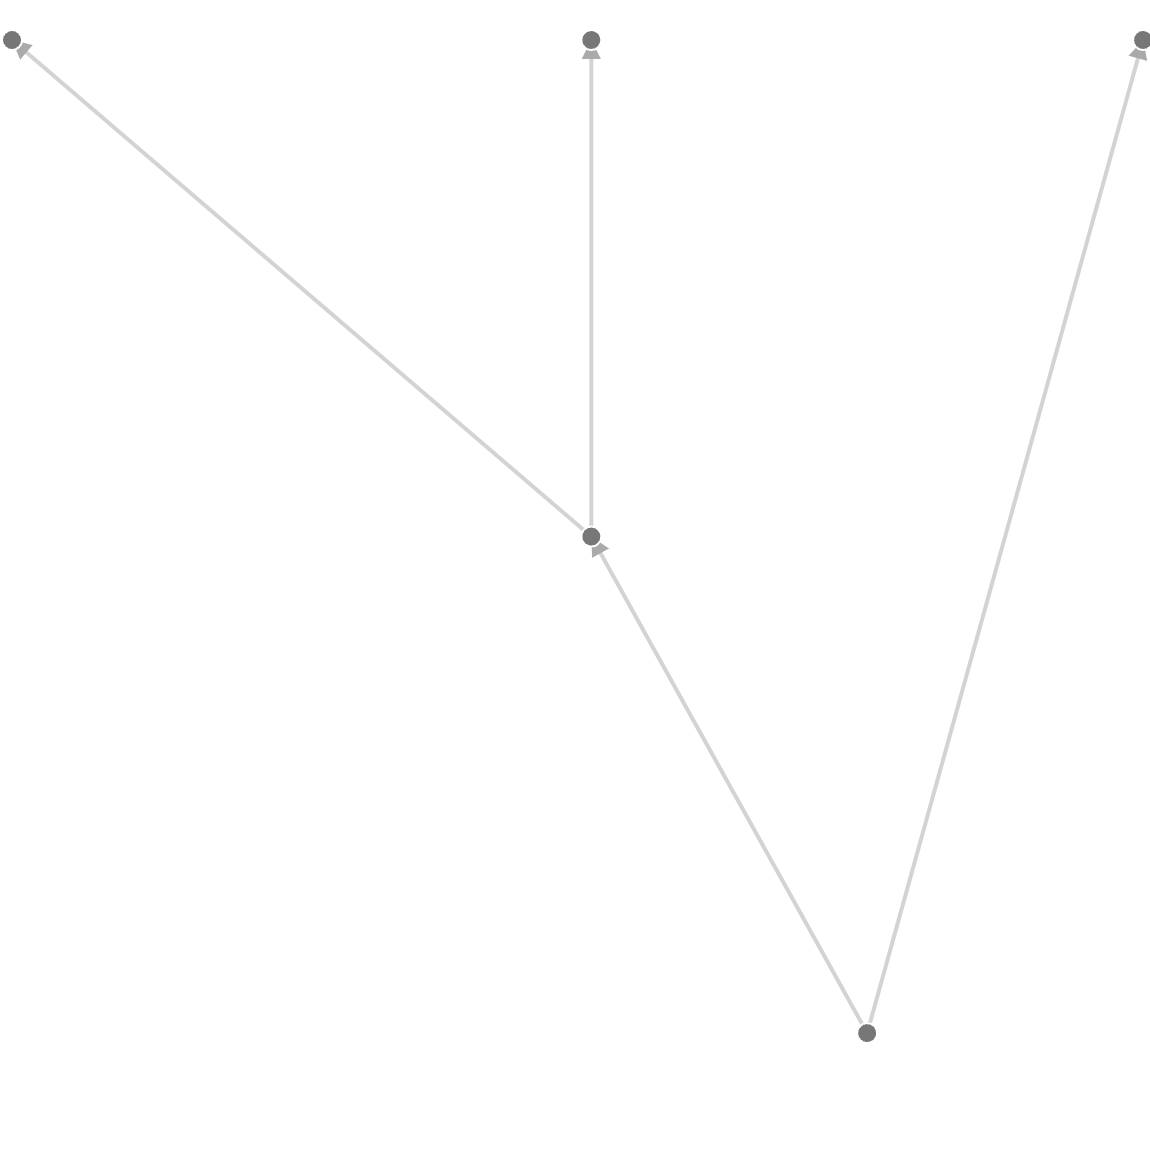
Set Directness
Swap Nodes And Edges
Calculate
Connectivity Based Attribute
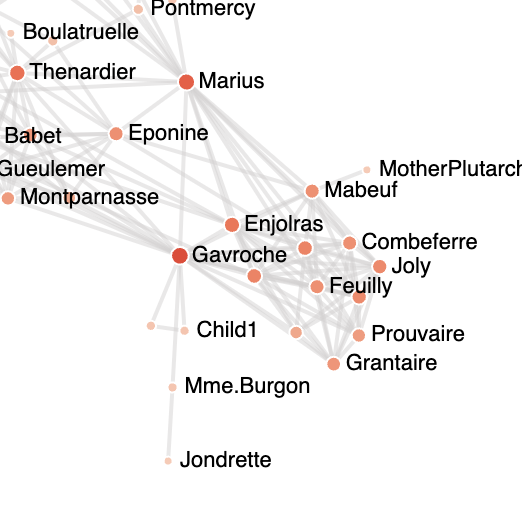
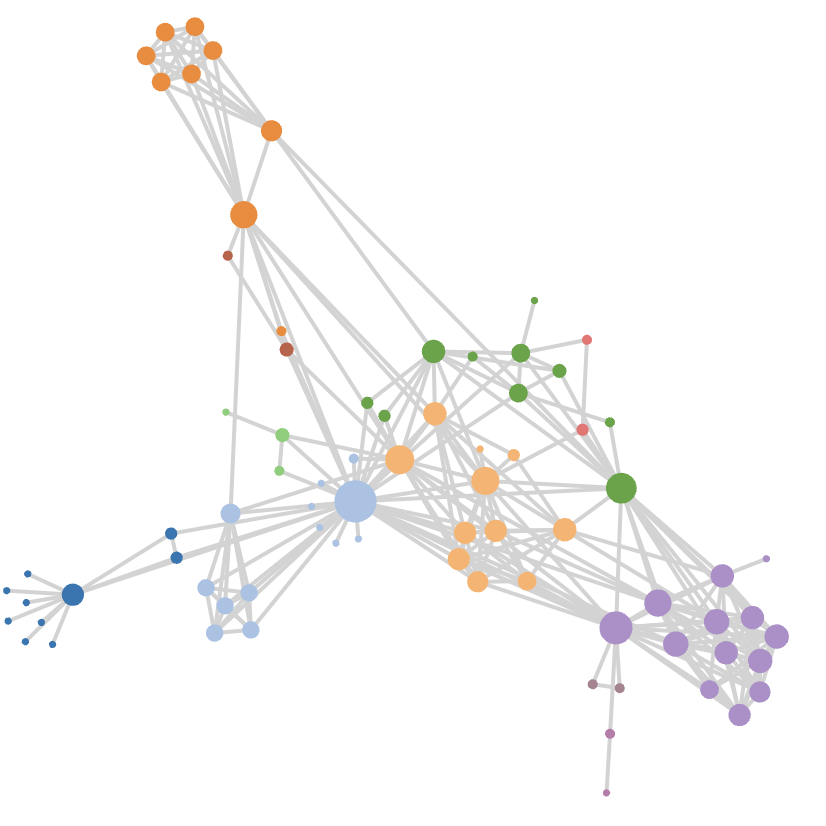
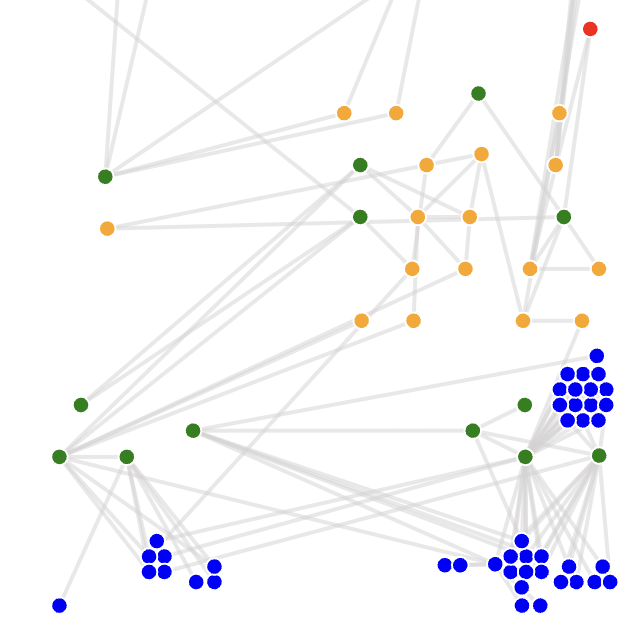
Clustering
Project
Layout
Procedural
Geometric
Table
Induced
Ordering
Seriation
Attribute
Grouping
Grouping
Metrics
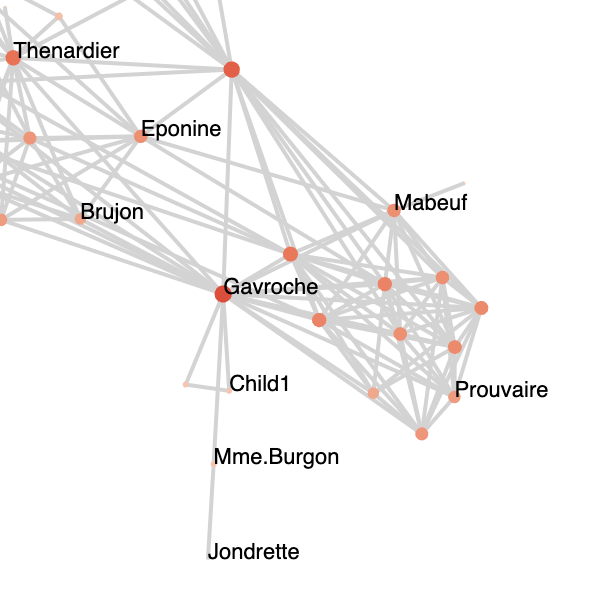
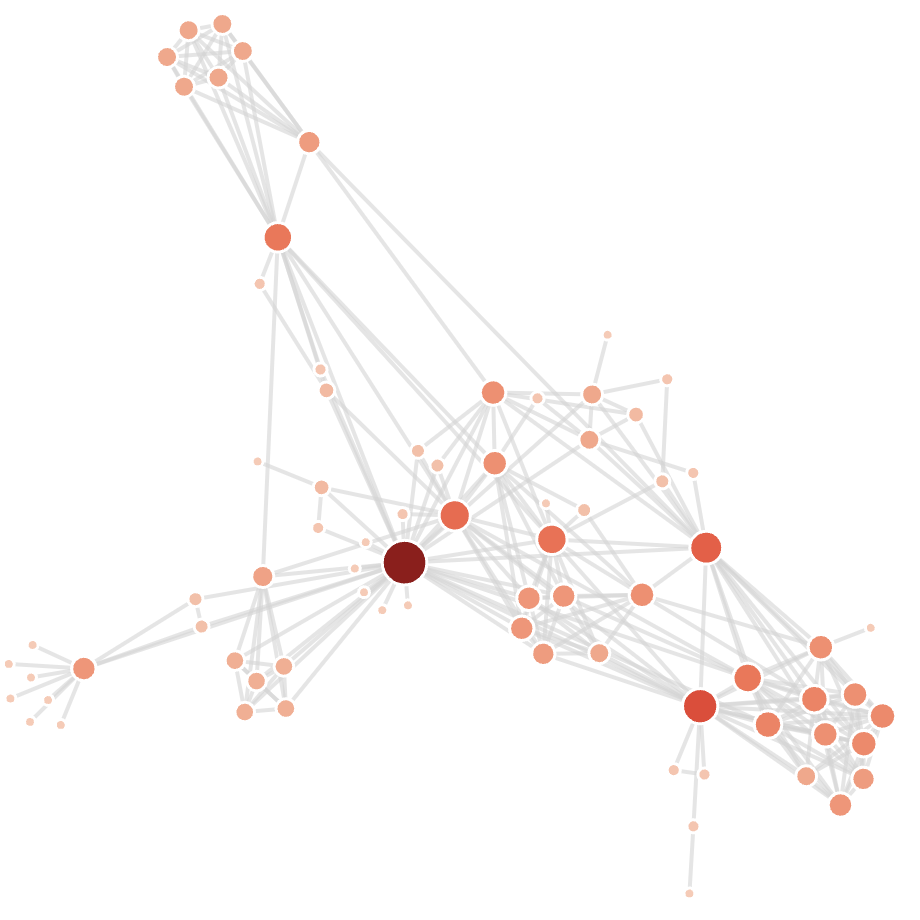
Metric
Data_type
Time
Geo
Node-attributes
Link-attributes
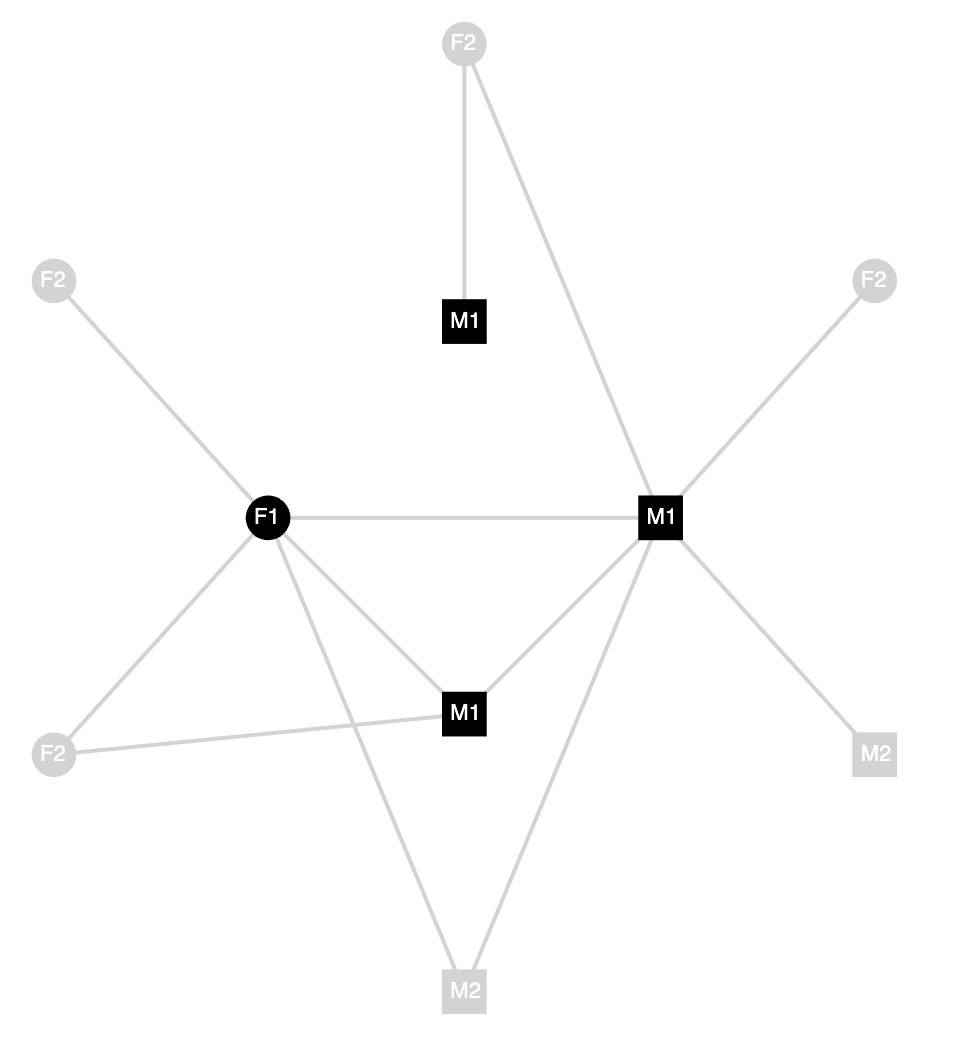
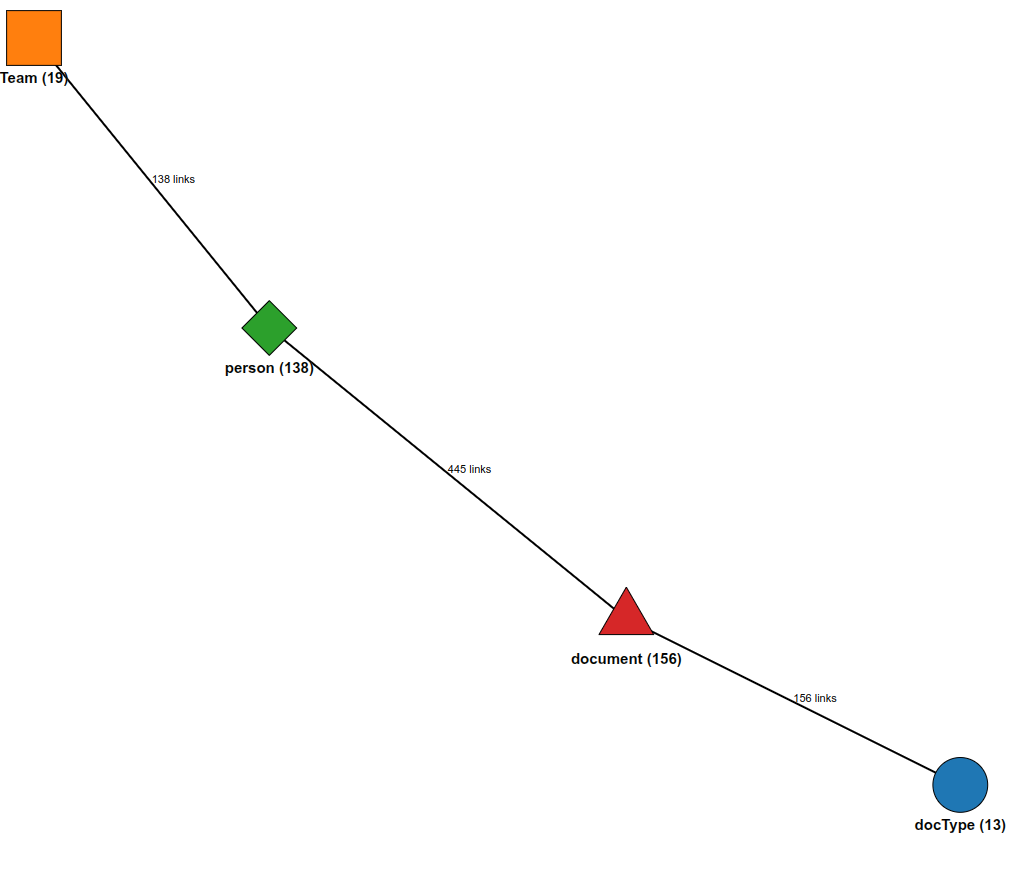
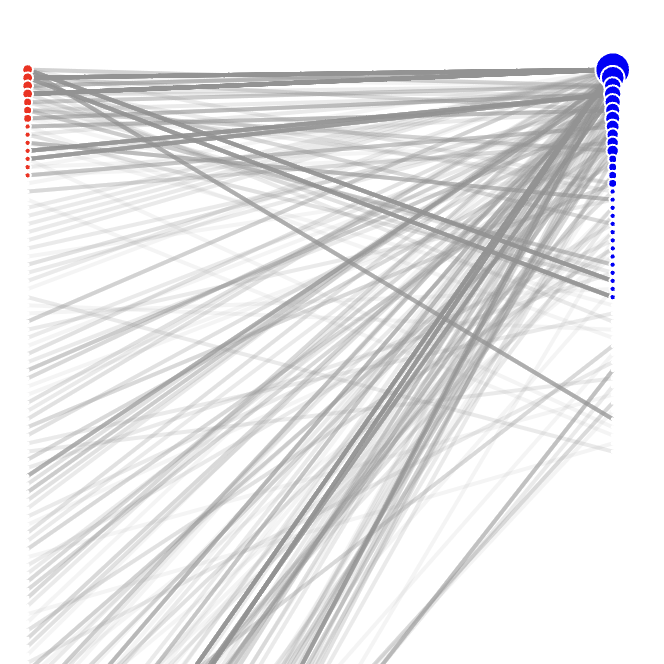
Bipartite
Expressions
Expressions
Visual Mapping
Scale
Label Occlusion
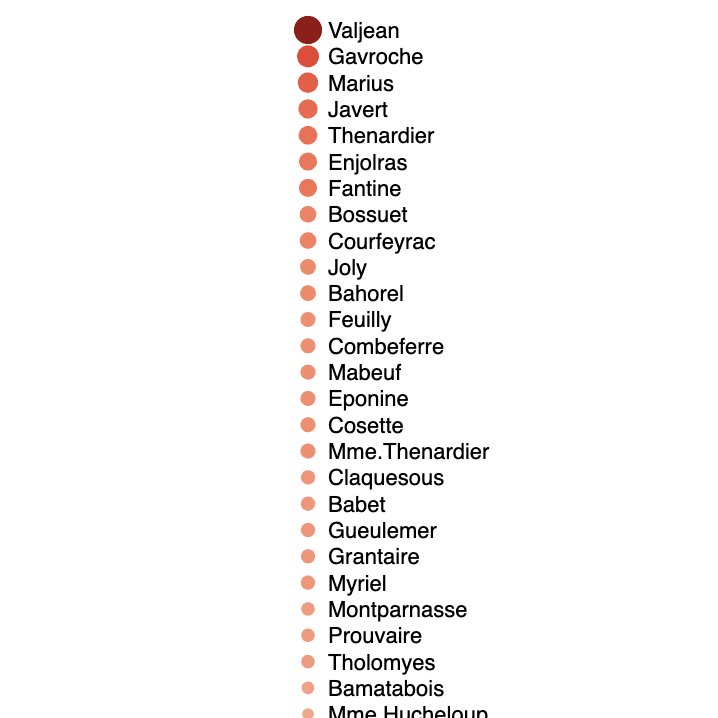
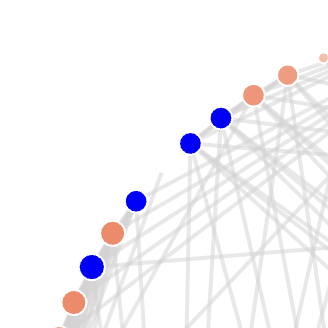
Color
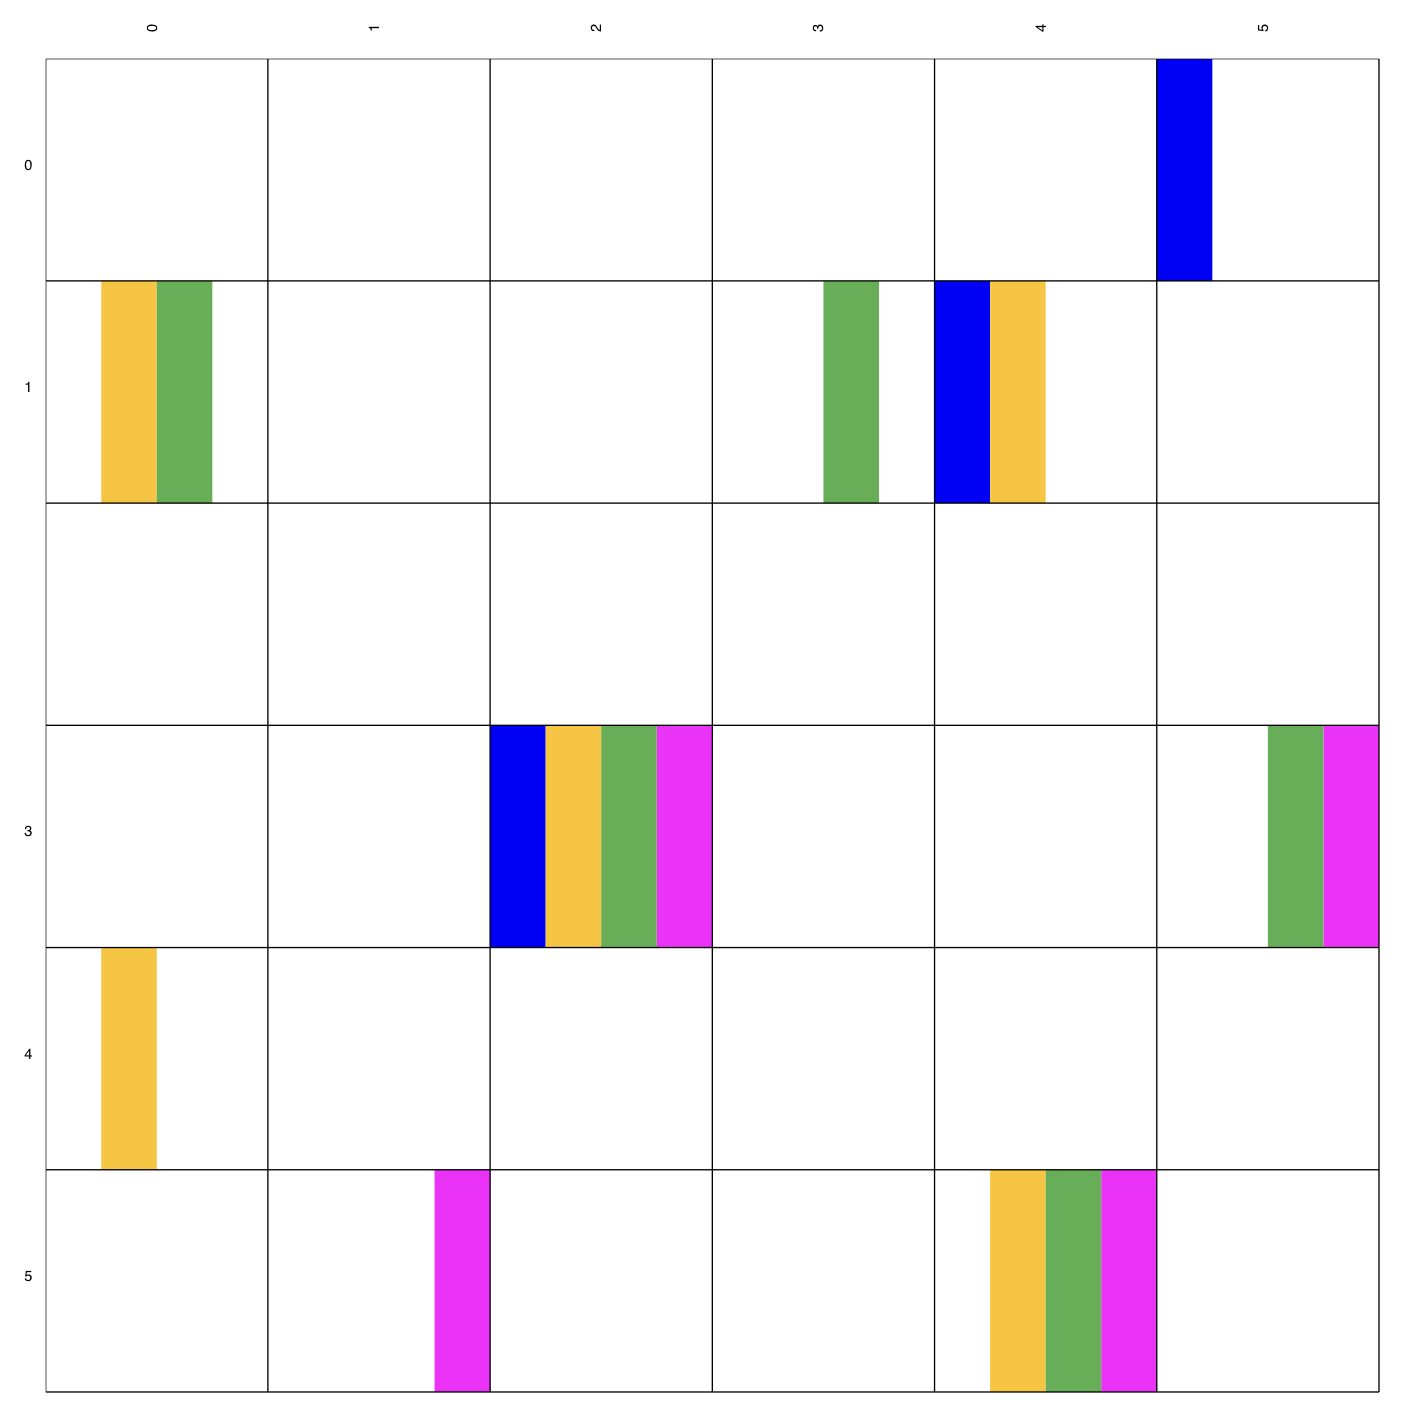
Parallel-links
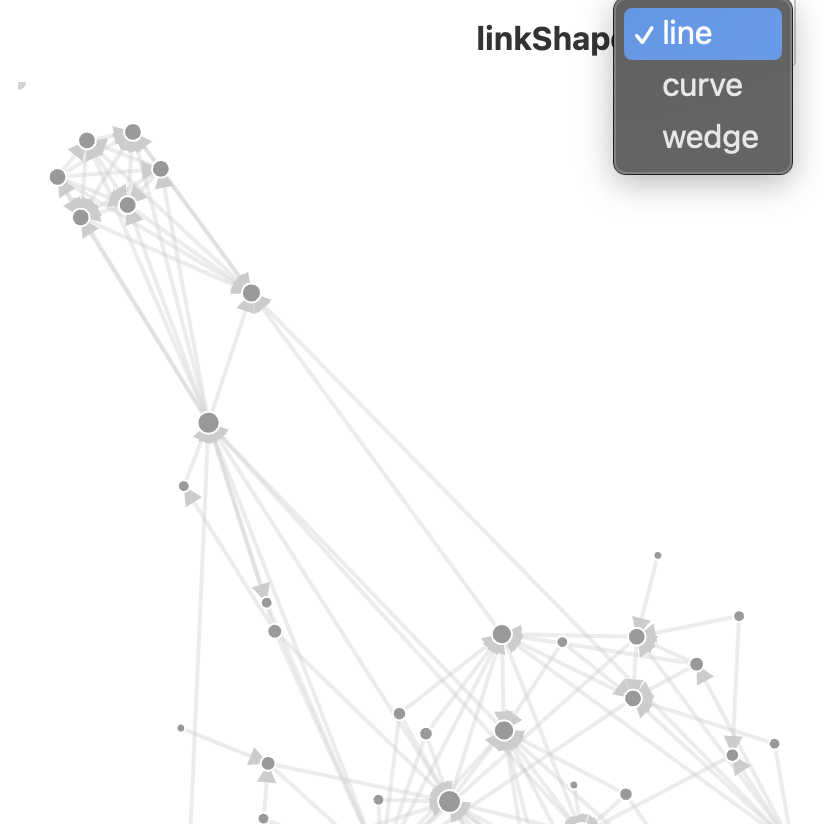
Link Path
Shape
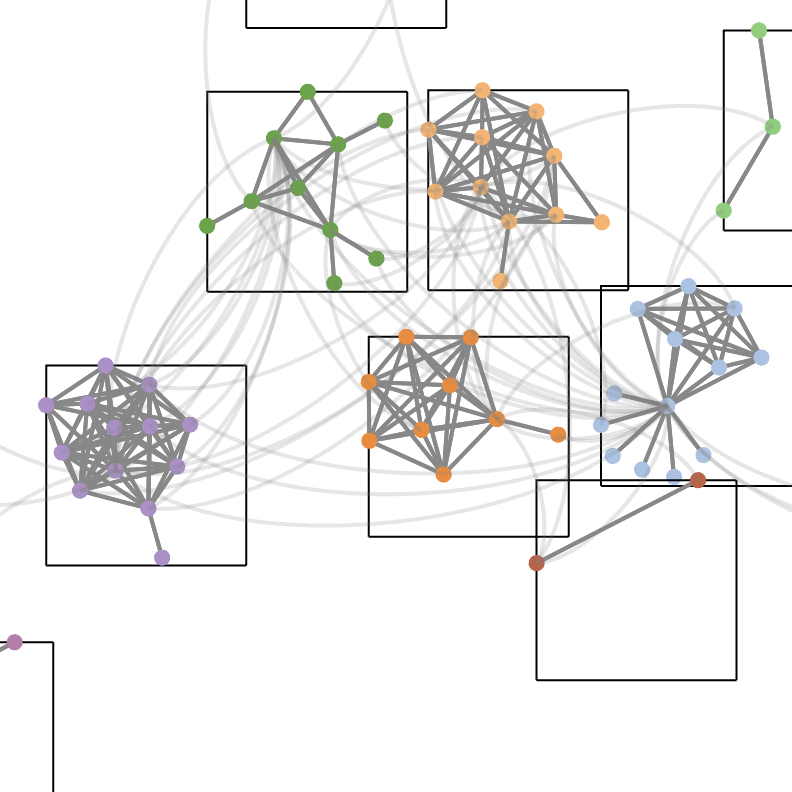
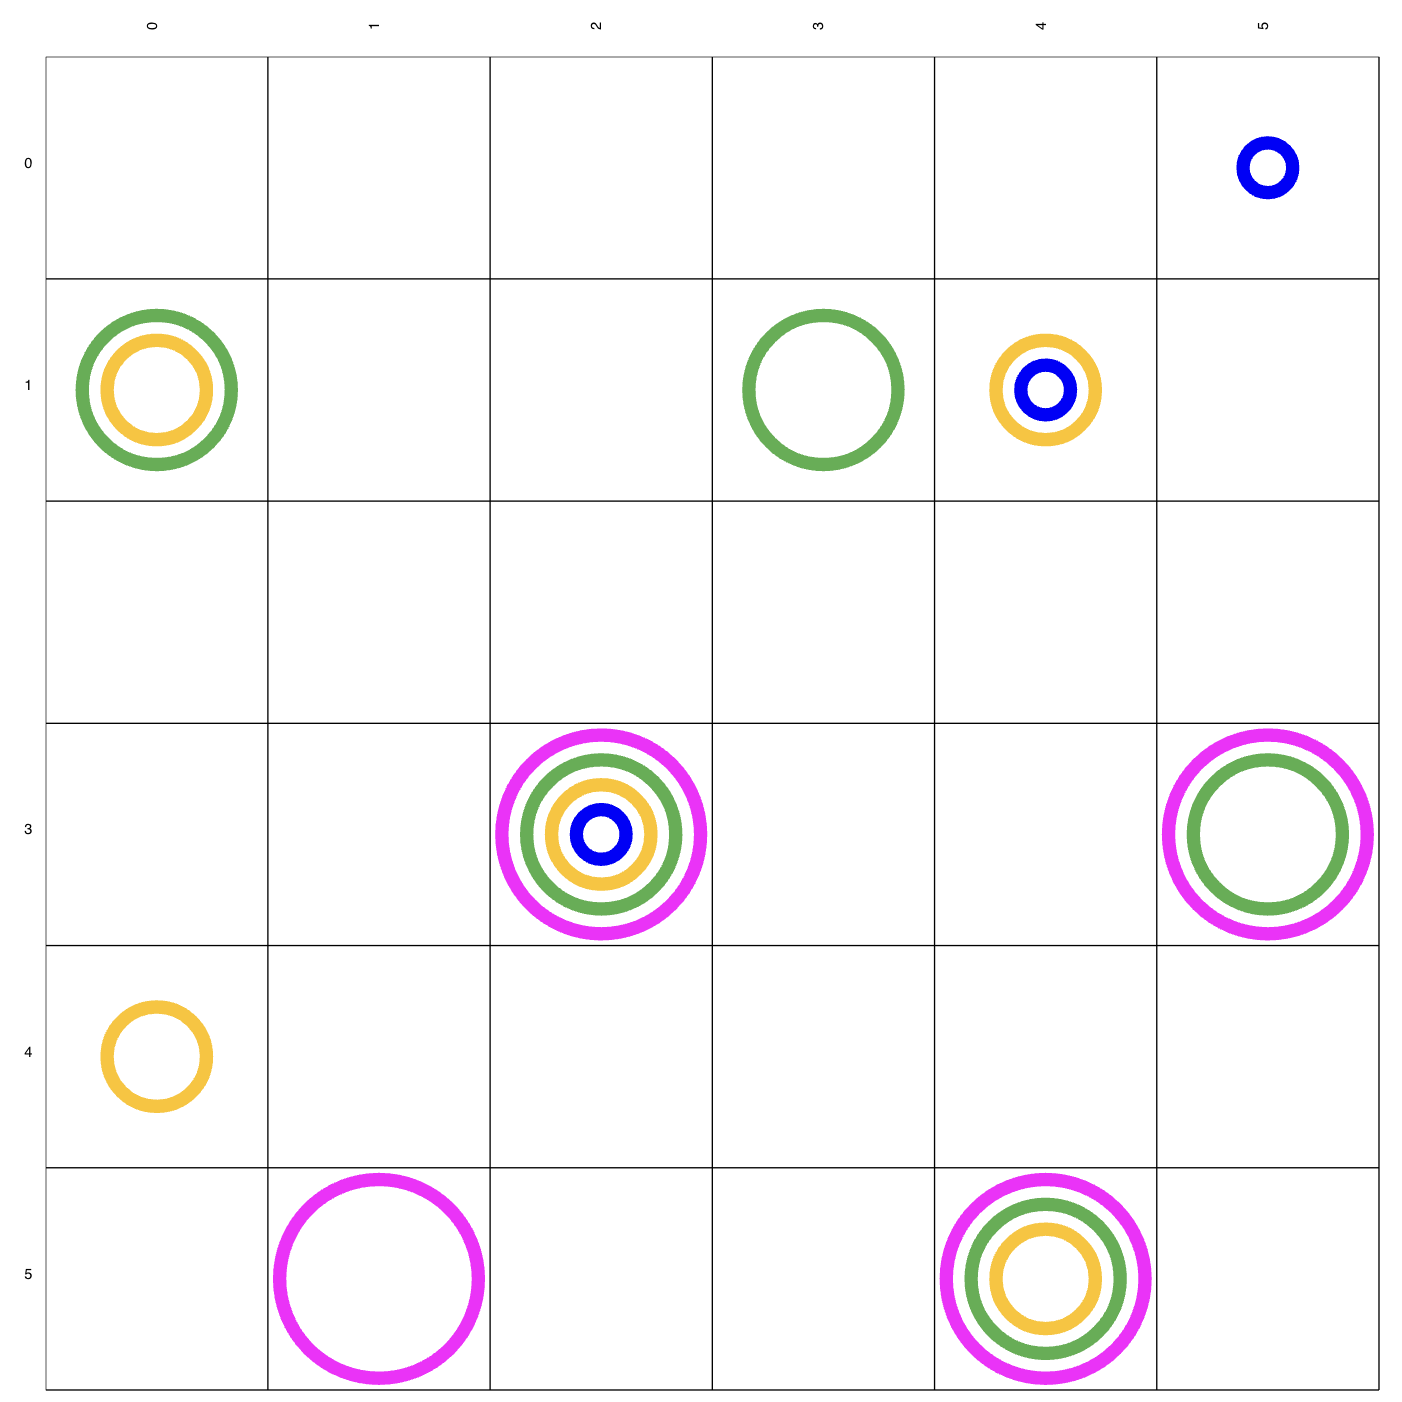
Nesting
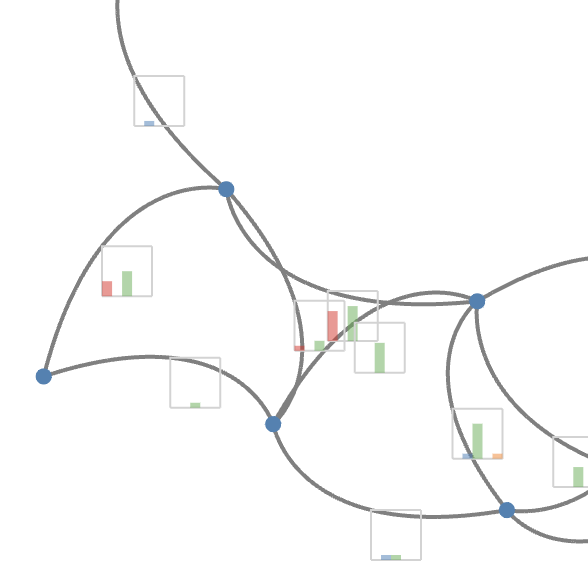
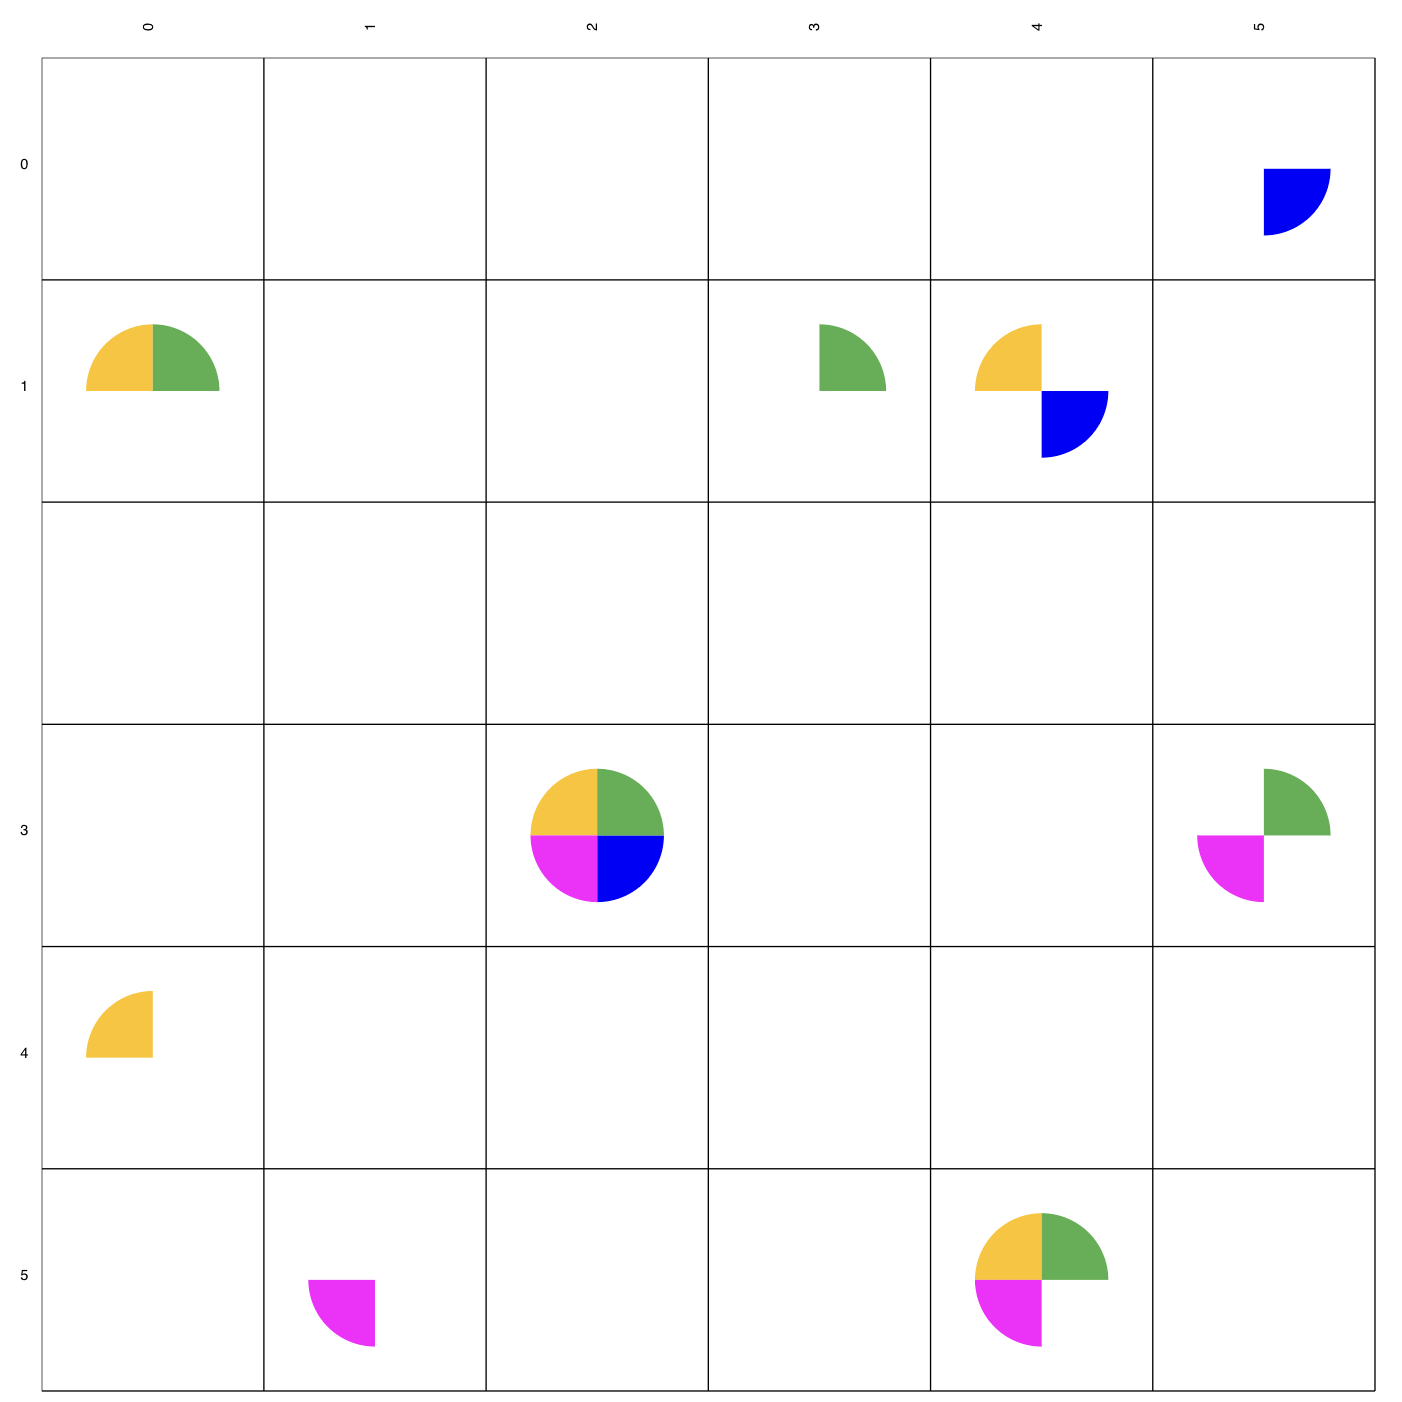
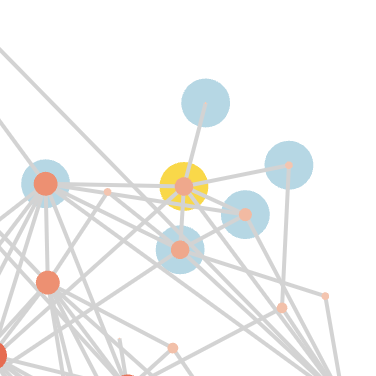
Glyphs
Interaction
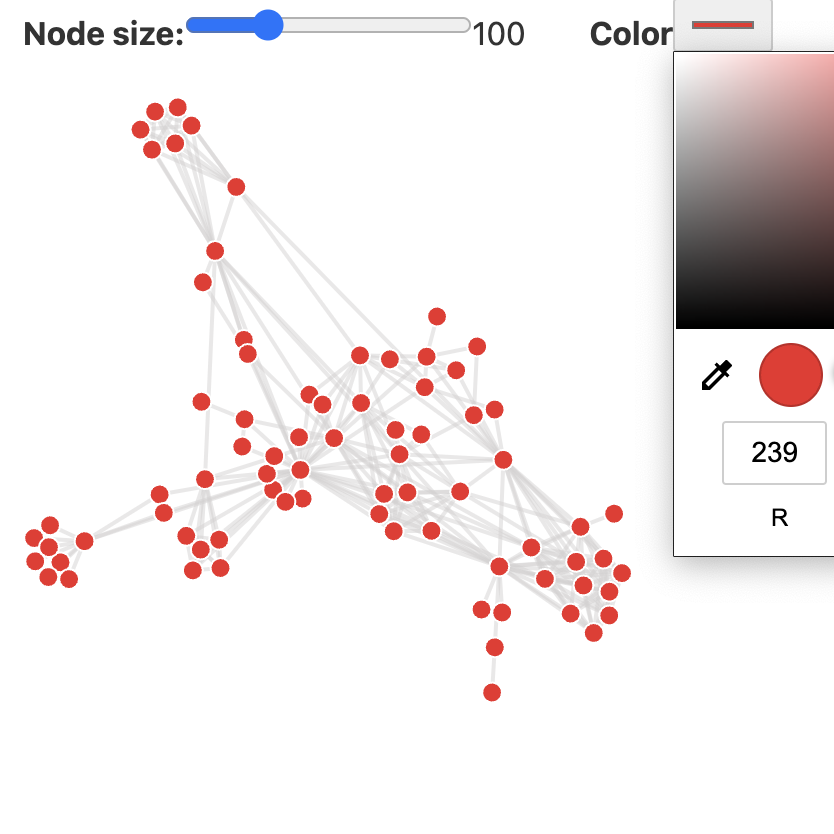
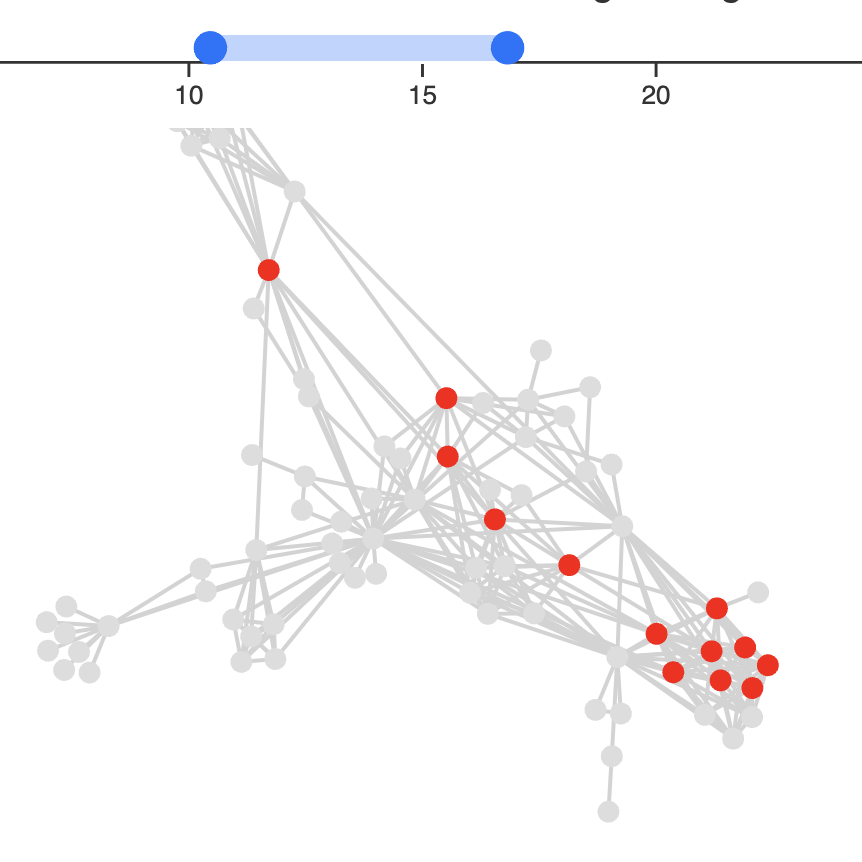
Parameters
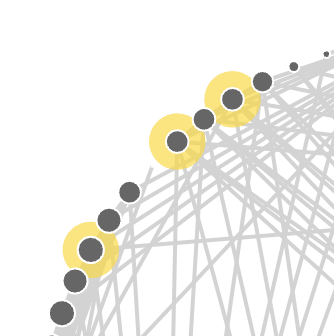
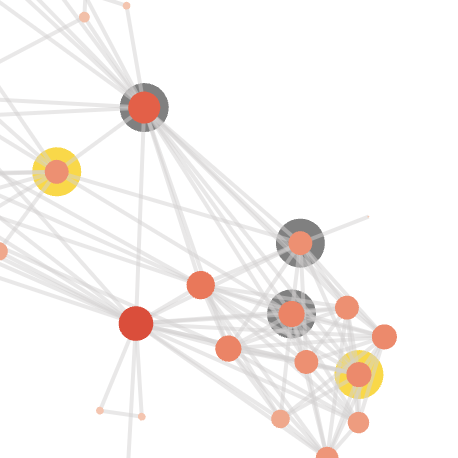
Highlight
Pan And Zoom
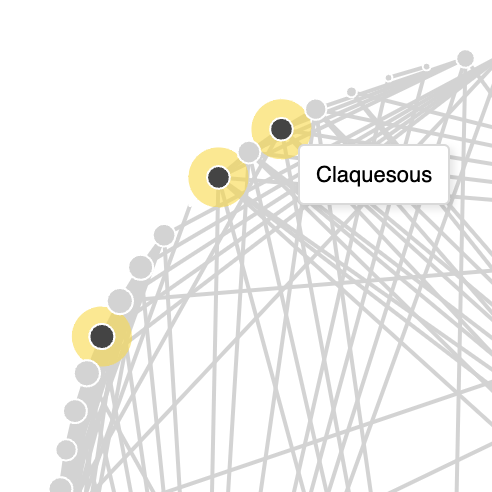
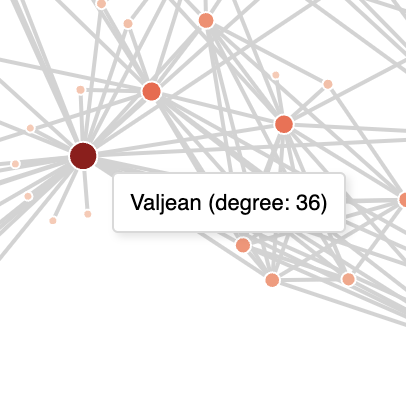
Fixed Labels
Selections